Customer Support : 020-61923200, [email protected] | Call and Trade : 020-61923220

Balance of Power
#momentum
Inventor: Igor Livshin
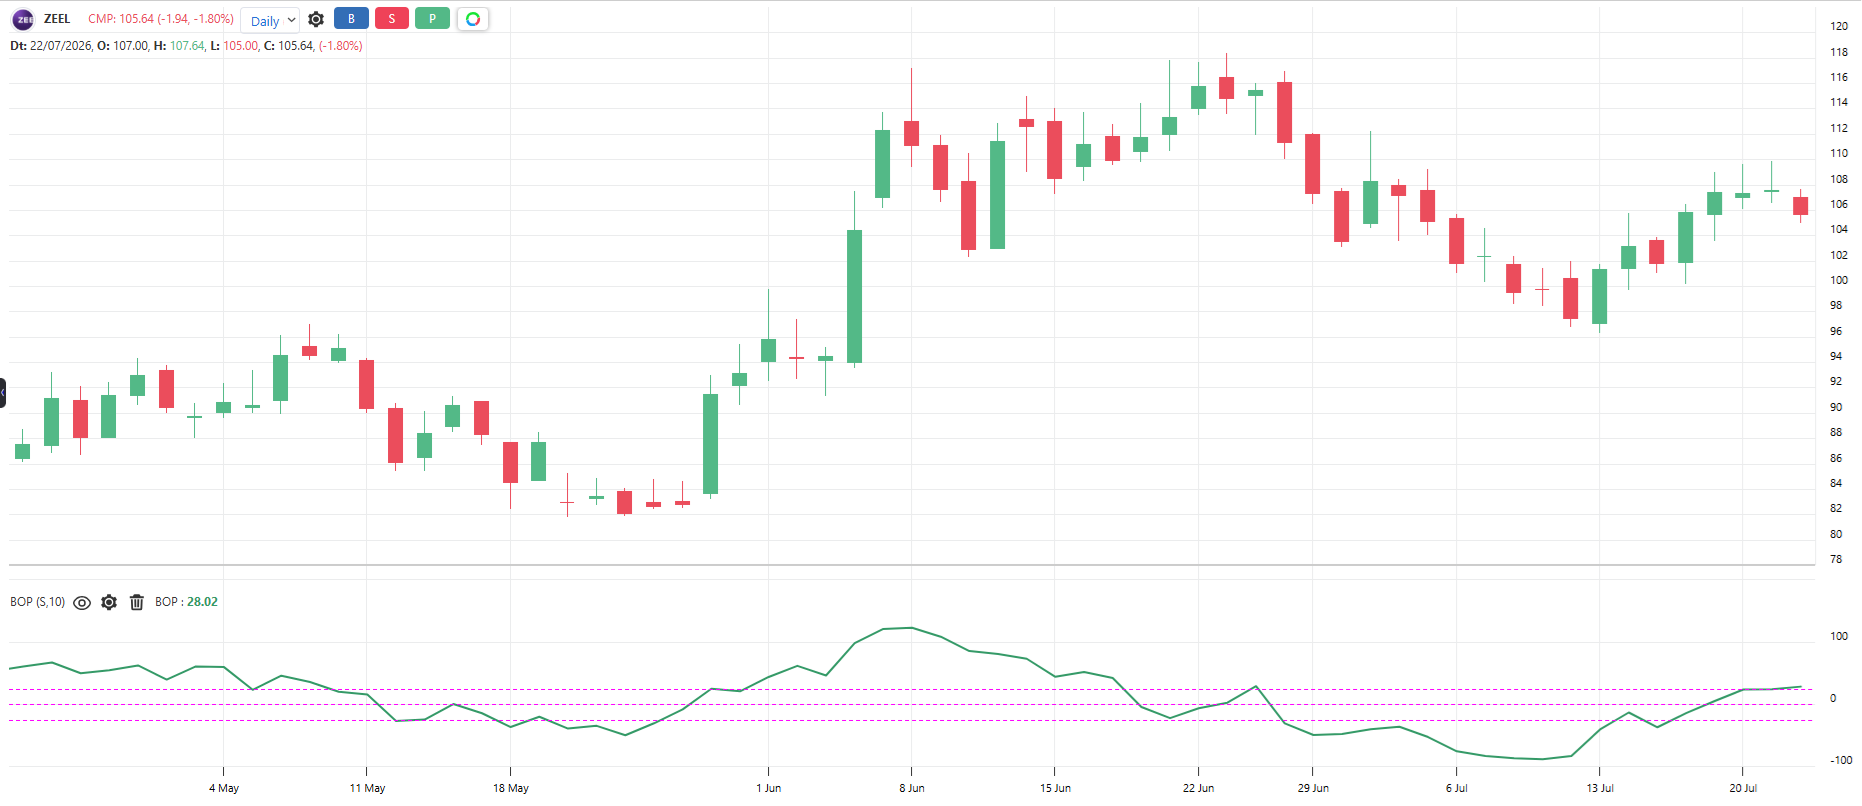
Measures who won each bar, buyers or sellers. It compares where the bar closed against where it opened, relative to the bar’s full high-low range: (Close – Open) / (High – Low). Usually smoothed with a moving average to make the line readable.
Default period: 10 (smoothing average)
Line above zero indicates buyers are winning the bars. Line below zero indicates sellers are winning the bars.
Useful readings:
BOP above zero and rising: Buyers in control and getting stronger
BOP below zero and falling: Sellers in control and getting stronger
BOP near zero: Even fight, no side in control
BOP rising while price falls: Selling pressure fading, bounce possible
BOP falling while price rises: Buying pressure fading, be careful with longs
BOP makes higher lows while price makes lower lows: Bullish divergence
Objective rules:
Bullish: Smoothed BOP crosses above zero.
Bearish: Smoothed BOP crosses below zero.
Trend filter: Take longs only when price is above 200 SMA, shorts only when below
Divergence rule: Price at new low but BOP above its last low, tighten stops on shorts
What makes it unique:
It scores every single bar as a fight between buyers and sellers using only that bar’s own anatomy. No lookback comparisons – each candle carries its own verdict.
The indicator table value in TradePoint & RZone also provides you with a list of all values of this indicator for any group of stocks. This will allow you to compare the readings of this indicator across different stocks.
This indicator is also available in the System Builder of RZone & TradePoint for all charting methods. Using the system builder, you can develop various strategies based on the different conditions already present in this indicator. Additionally, it can be used with other indicators or price patterns to develop effective trading strategies. For any group of stocks and market segments, you can scan and backtest stocks based on those strategies.
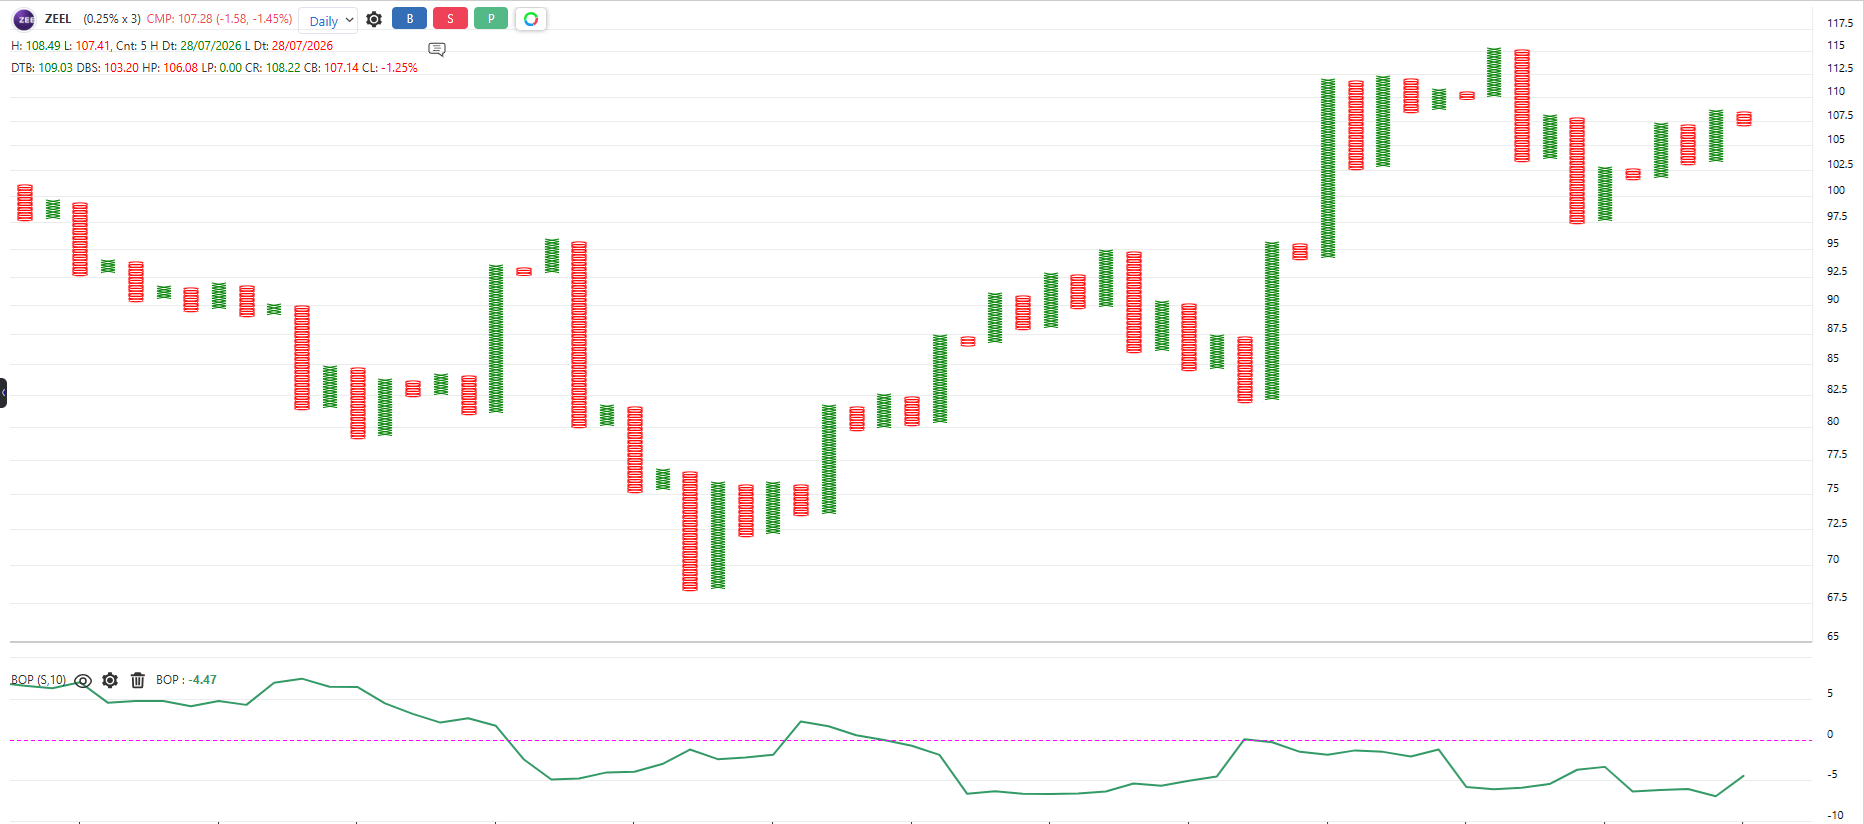
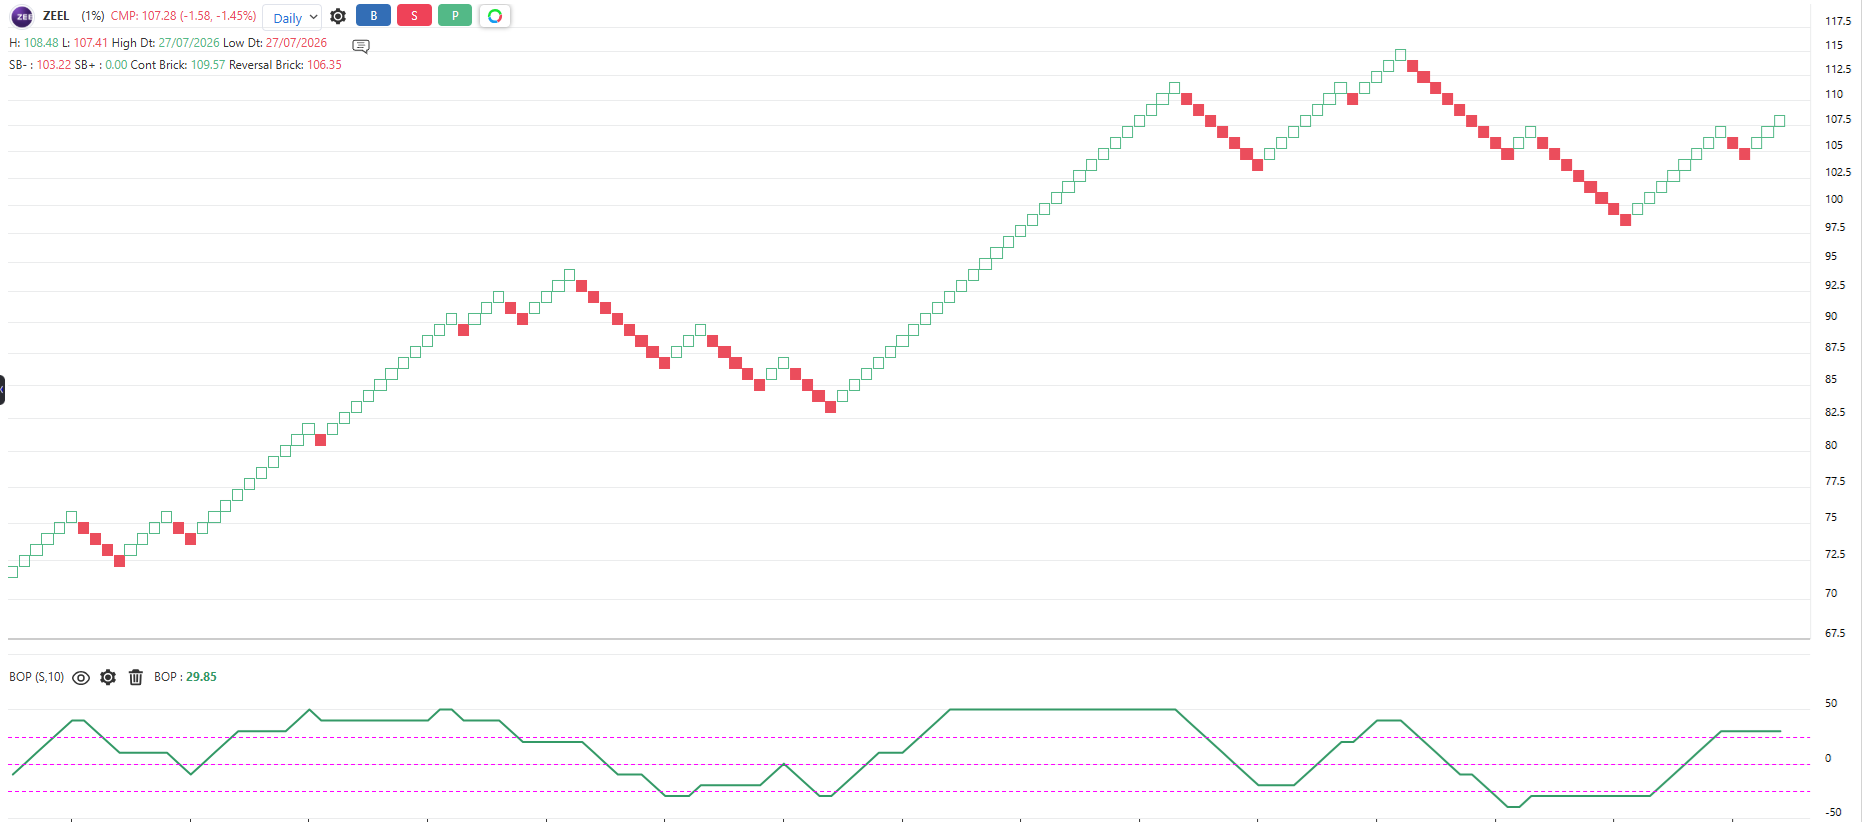
The indicator is applicable to all types of charting. Calculated based on the number of columns on P&F charts, bricks on Renko charts, lines on Line-break charts, candles on Heikin ashi charts, and lines on Kagi charts. While the formula and reading of the indicators remain the same, they become more dynamic on these charts.