Customer Support : 020-61923200, [email protected] | Call and Trade : 020-61923220

Negative Volume Index (NVI)
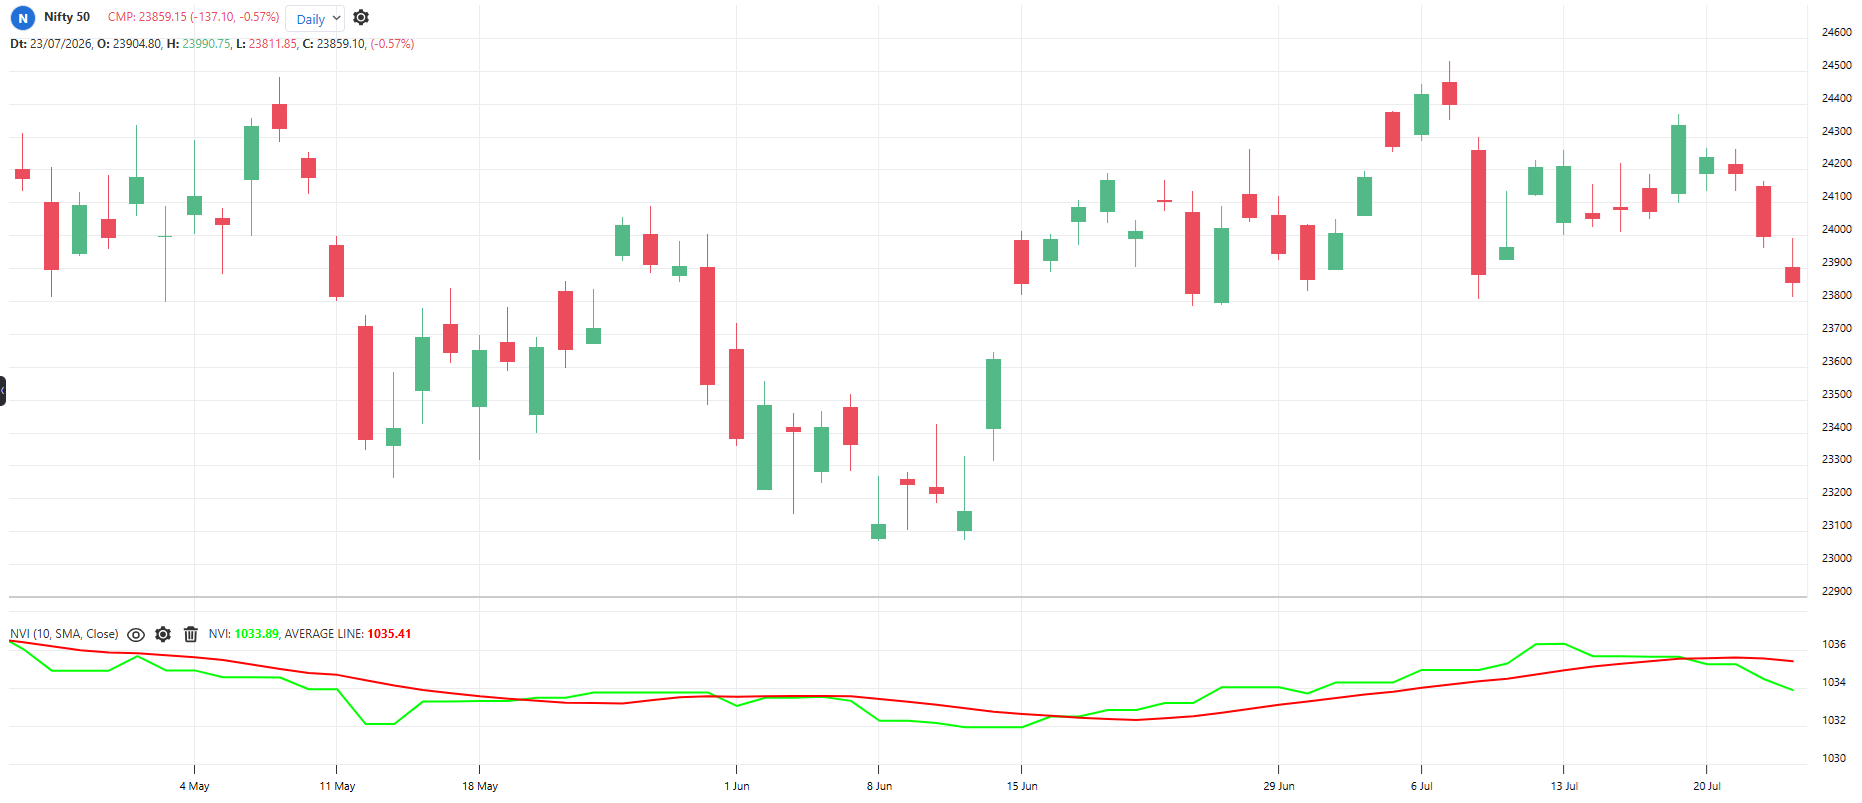
#volume #smartmoney
Inventor: Paul Dysart; refined by Norman Fosback
A cumulative line that changes only on days when volume falls below the previous day. The idea: crowds trade on loud high-volume days, but quiet low-volume days show what patient smart money is doing. NVI adds the day’s percentage price change only on those quiet days. Read against its own long-term average.
Default period: 10-day SMA of NVI as signal line
NVI rising indicates prices climbing on quiet days, smart money buying. NVI falling indicates prices dropping on quiet days, smart money selling.
Useful readings:
NVI above its 255-day average: Historically strong odds that a bull market is on
NVI below its 255-day average: Weak market conditions, caution
NVI rising while price is flat: Quiet accumulation, bullish clue
NVI falling while price rises: Rally driven by noisy crowd days only, fragile
NVI crossing above its average: Long-term buy condition forming
Slow indicator, meant for daily charts and positional decisions
Objective rules:
Bullish: NVI crosses above its 255-day EMA.
Bearish: NVI crosses below its 255-day EMA.
Investment filter: Favor long positions while NVI holds above its 255-day EMA
Confirmation rule: Take breakouts more seriously when NVI is also rising
What makes it unique:
It listens only on quiet days, ignoring the noisy sessions everyone else studies. Fosback’s research on its strong bull-market odds made it a classic.
The indicator table value in TradePoint & RZone also provides you with a list of all values of this indicator for any group of stocks. This will allow you to compare the readings of this indicator across different stocks.
This indicator is also available in the System Builder of RZone & TradePoint for all charting methods. Using the system builder, you can develop various strategies based on the different conditions already present in this indicator. Additionally, it can be used with other indicators or price patterns to develop effective trading strategies. For any group of stocks and market segments, you can scan and backtest stocks based on those strategies.
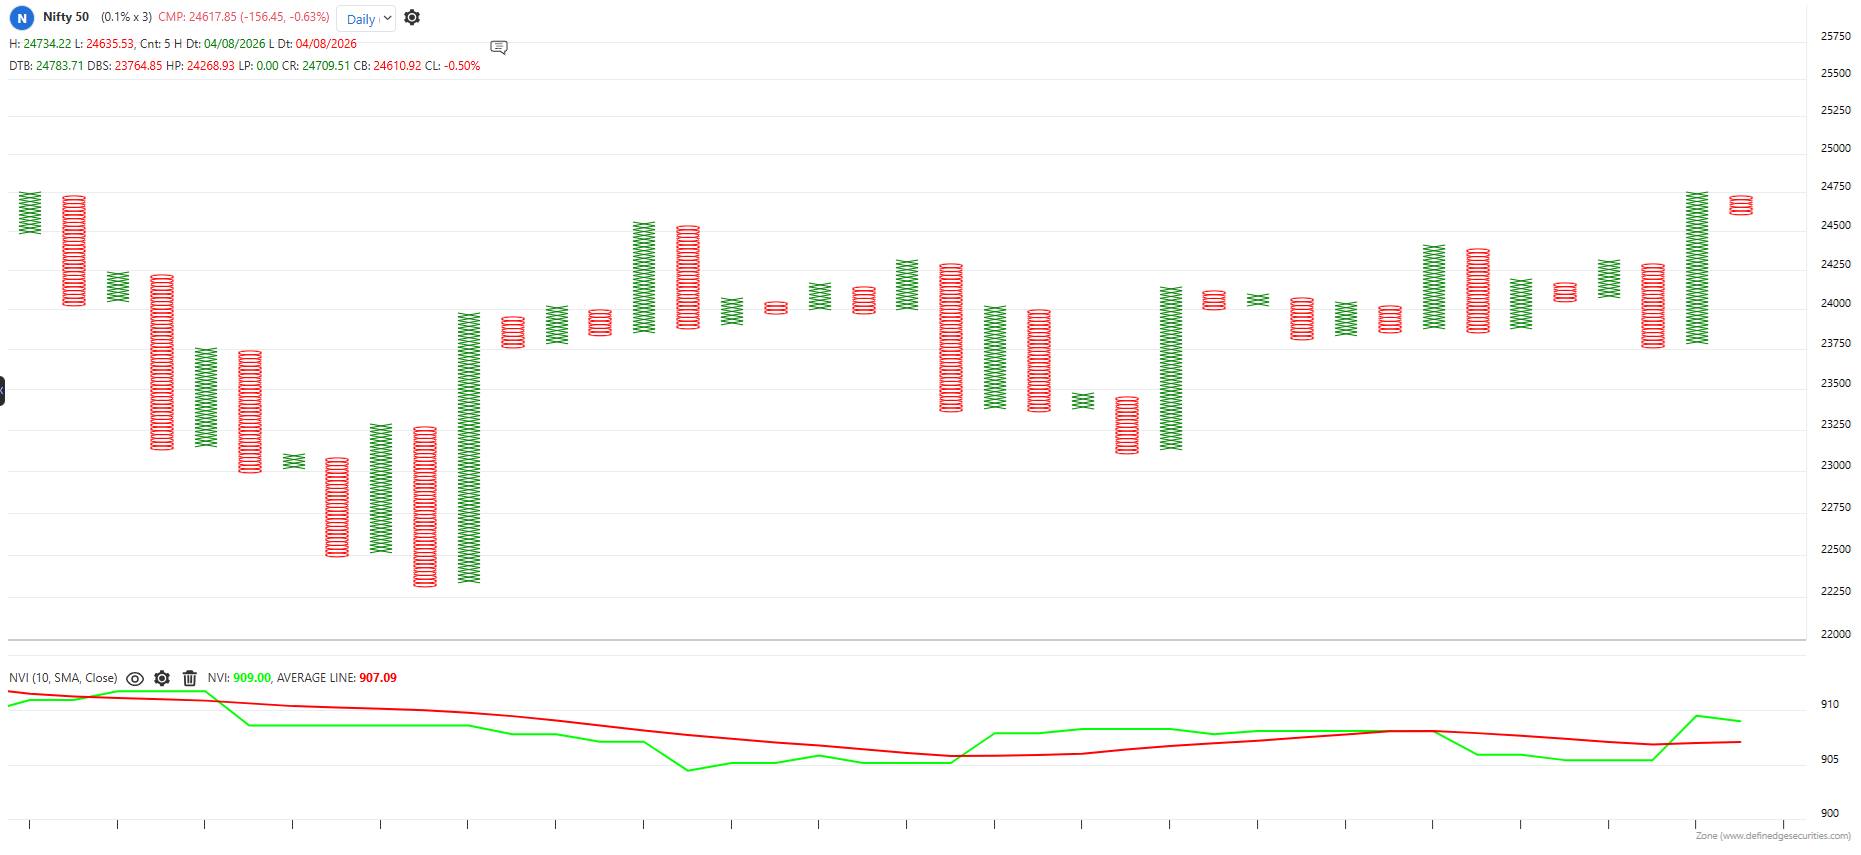
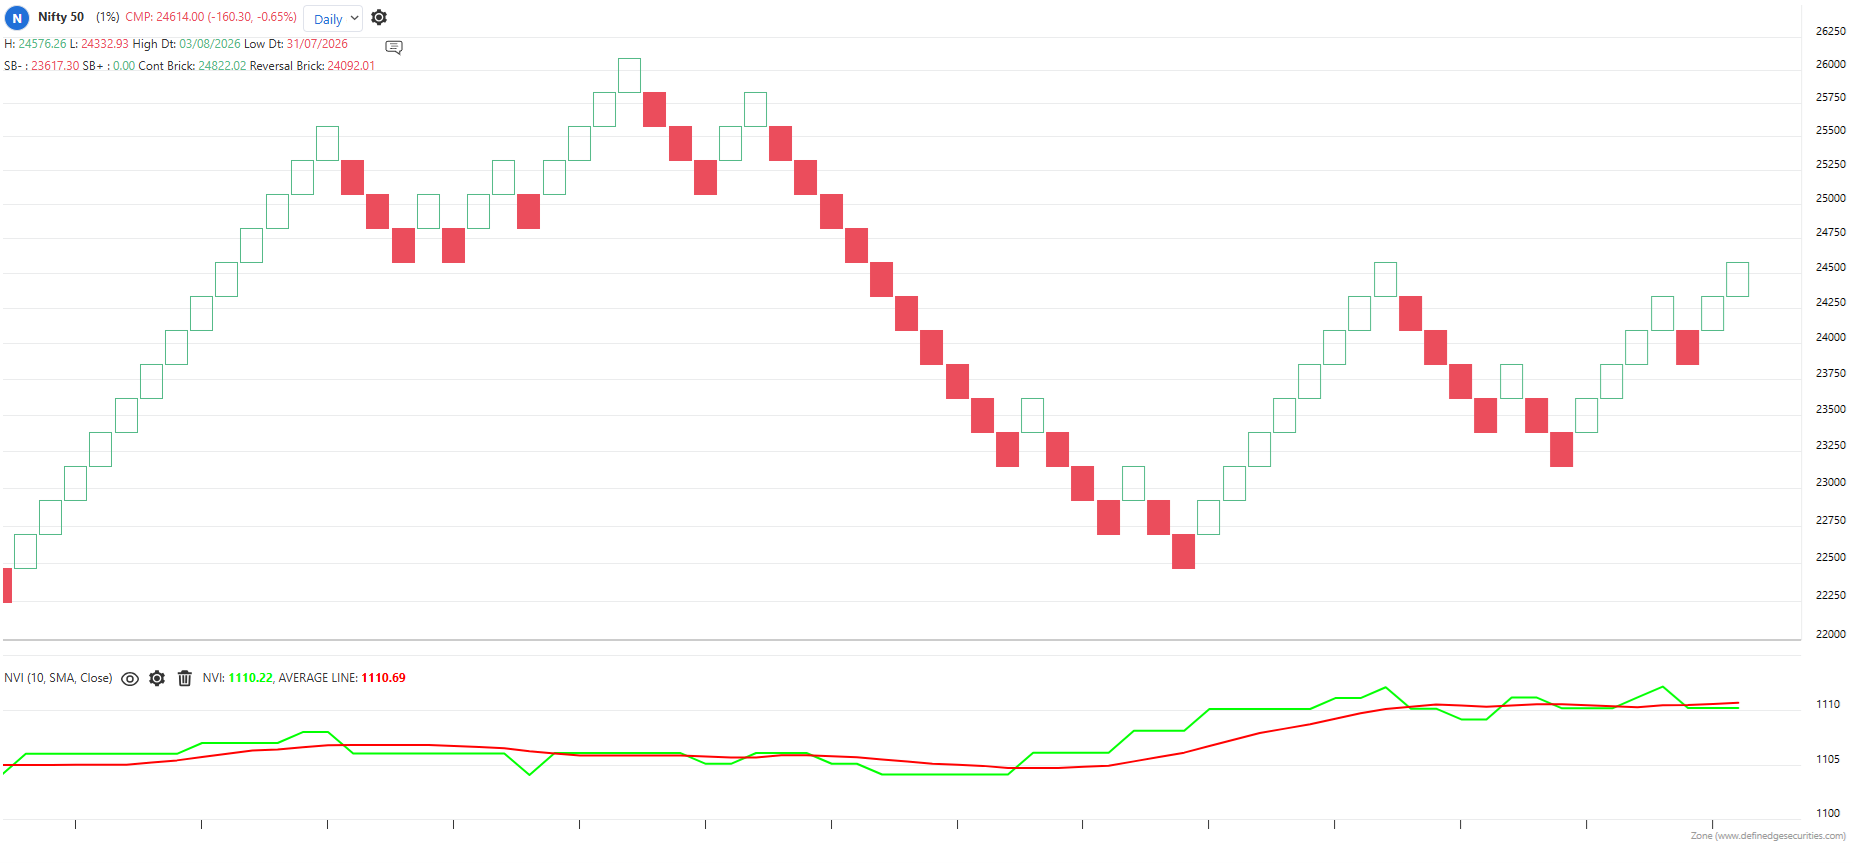 The indicator is applicable to all types of charting. Calculated based on the number of columns on P&F charts, bricks on Renko charts, lines on Line-break charts, candles on Heikin ashi charts, and lines on Kagi charts. While the formula and reading of the indicators remain the same, they become more dynamic on these charts.