Customer Support : 020-61923200, [email protected] | Call and Trade : 020-61923220
Efficiency
#efficiency #trend-quality #noise #directional-strength
Efficiency tells you how direct the price movement is. It compares the net distance price has traveled to the total distance it covered getting there. If price moves from 100 to 110 in a straight line, efficiency is 100% — every point counted. If price zigzags wildly but still ends at 110, efficiency is low — most of the movement was noise. It’s a gauge of trend quality: high efficiency means clean trends, low efficiency means choppy noise.
Default period: 5
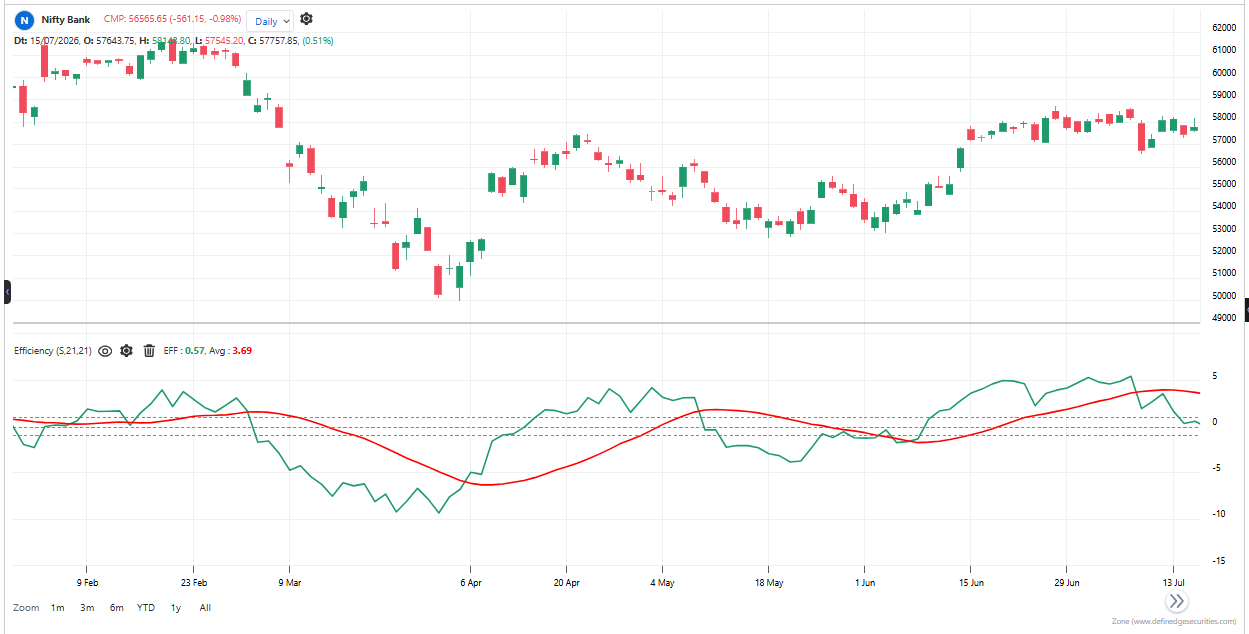
How to read it:
A single line that moves between 0% and 100%. High readings mean price is moving in a straight, direct line — the trend is clean and efficient. Low readings mean price is zigzagging — the trend is choppy and inefficient. A reading of 80% means 80% of the movement was directional and only 20% was noise. A reading of 20% means 80% was noise and only 20% was directional.
Useful readings:
– Above 50% — the trend is more directional than noisy. Clean movement. Trend-following strategies work well.
– Below 50% — the movement is more noisy than directional. Choppy. Trend-following strategies will get whipsawed.
– Rising — the trend is becoming cleaner. Noise is decreasing. Trend quality is improving.
– Falling — the trend is becoming choppier. Noise is increasing. Trend quality is deteriorating.
– Near 100% — almost perfectly straight movement. Very strong, unidirectional trend. Rare but powerful.
– Near 0% — price is moving everywhere but getting nowhere. Maximum chop. Stay out.
Use cases:
– Strategy selector: When Efficiency is high, use trend-following strategies. When Efficiency is low, use mean-reversion or range-trading strategies. This is the single most important use.
– Trend filter: Only take trend signals when Efficiency is above 50%. Below 50%, the trend is too choppy to follow reliably.
– Early trend detection: Efficiency starts rising before the trend is obvious — because price starts moving more directly. That’s your early warning.
– Exit signal: Efficiency falls before price reverses — because the trend starts getting choppy before it turns. That’s your early exit.
– Position sizing: Larger positions when Efficiency is high (clean trends = higher win rate). Smaller positions when Efficiency is low.
Objective rules:
– Only trade trend signals when Efficiency is above 50%.
– Avoid trend trading when Efficiency is below 30% — the chop is too severe.
– Enter when Efficiency starts rising from low levels — a clean trend may be starting.
– Exit when Efficiency starts falling from high levels — the trend is getting choppy.
– Use as a filter, not a standalone signal. Combine with your own entry triggers.
What makes it unique: Every other indicator tries to predict direction. Efficiency doesn’t care about direction — it measures quality. A rising trend and a falling trend can both be highly efficient. What matters is whether the movement is clean or choppy. This is the indicator that tells you how the market is moving, not where. And knowing “how” is often more important than knowing “where” — because it tells you which strategy to use.
The indicator table value in TradePoint & RZone also provides you with a list of all values of this indicator for any group of stocks. This will allow you to compare the readings of this indicator across different stocks.
This indicator is also available in the System Builder on RZone & TradePoint for all charting methods. Using the system builder, you can develop various strategies based on the different conditions already present in this indicator. Additionally, it can be used with other indicators or price patterns to develop effective trading strategies. For any group of stocks and market segments, you can scan and backtest stocks based on those strategies.
The indicator is applicable to all types of charting. It is calculated based on the number of columns on P&F charts, bricks on Renko charts, lines on Line-break charts, candles on Heikin-Ashi charts, and lines on Kagi charts. While the formula and reading of the indicators remain the same, they become more dynamic on these charts.