Customer Support : 020-61923200, [email protected] | Call and Trade : 020-61923220

Safe Zone
#stoploss #trendfollowing #volatility
Inventor: Dr. Alexander Elder
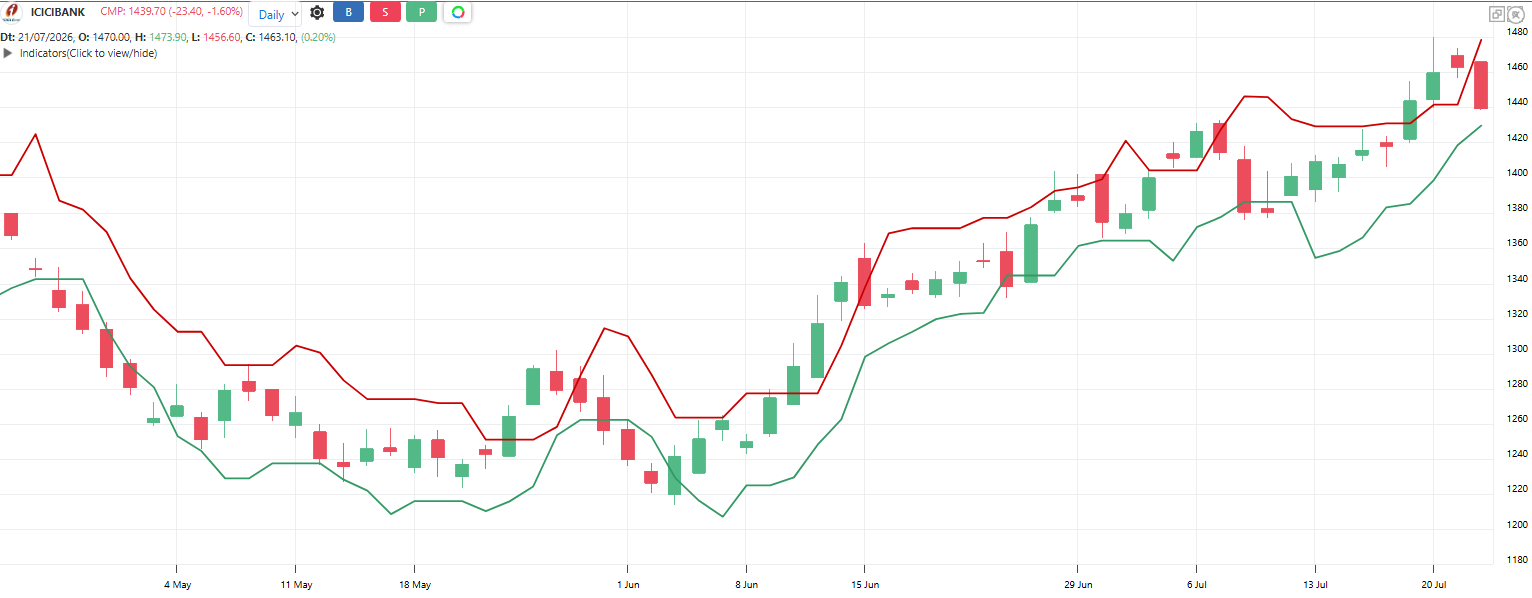
Dr. Alexander Elder’s trailing stop. It measures the market’s normal downside noise in an uptrend: the average size of the dips that poke below the previous bar’s low. The stop is placed that average noise, times a multiplier, below the recent low – so normal shakeouts miss it, but a real trend change hits it. In downtrends the same logic is mirrored above the highs. Same family as the ATR Stop-loss, but it measures only against-the-trend noise instead of the whole range.
Default period: 10, 2 to 3 (lookback, noise multiplier)
Stop line below price in an uptrend, rising with the trend. Stop line above price in a downtrend, falling with the trend.
Useful readings:
Price stays above the rising stop: Uptrend healthy, dips are just noise
Price closes below the stop: Move bigger than normal noise, uptrend in trouble
Stop line far from price: Noisy stock, wide risk, cut position size
Stop line hugging price: Quiet orderly trend, tight risk
Higher multiplier (3x): Survives deeper shakeouts, suits positional trades
Lower multiplier (2x): Quicker exits, suits swing trades
Objective rules:
Bullish: Price closes above the falling SafeZone stop (downtrend line broken).
Bearish: Price closes below the rising SafeZone stop (uptrend line broken).
Long trailing stop: Exit long when price closes below the stop line
Short trailing stop: Exit short when price closes above the stop line
Ratchet rule: In an uptrend never move the stop down; in a downtrend never move it up
Position size rule: Risk per share = Entry price – stop line value; divide fixed money risk by this
What makes it unique:
It measures only against-the-trend noise – the pokes below prior lows – rather than total volatility. Elder built it so normal shakeouts, by definition, cannot reach the stop.
The indicator table value in TradePoint & RZone also provides you with a list of all values of this indicator for any group of stocks. This will allow you to compare the readings of this indicator across different stocks.
This indicator is also available in the System Builder of RZone & TradePoint for all charting methods. Using the system builder, you can develop various strategies based on the different conditions already present in this indicator. Additionally, it can be used with other indicators or price patterns to develop effective trading strategies. For any group of stocks and market segments, you can scan and backtest stocks based on those strategies.
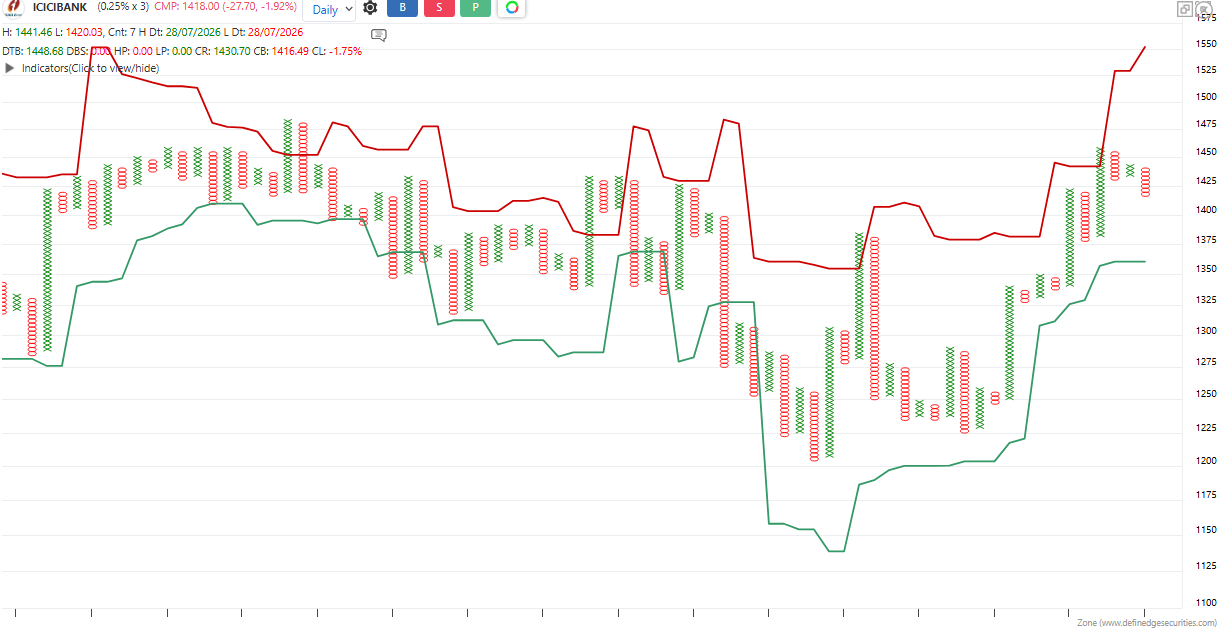
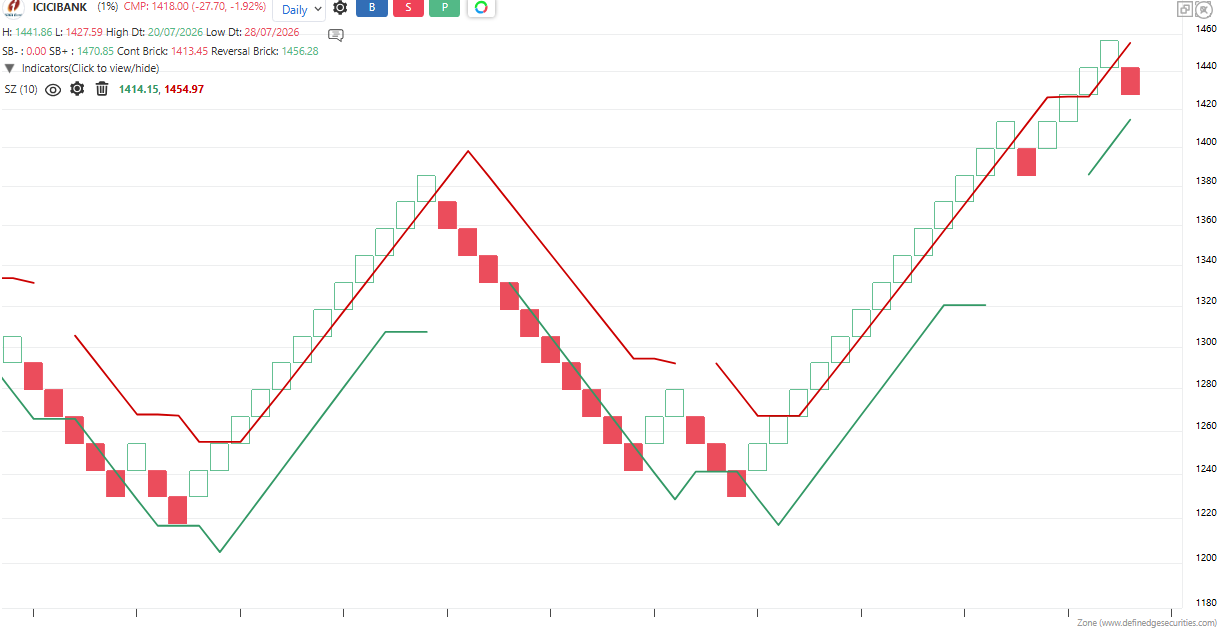
The indicator is applicable to all types of charting. Calculated based on the number of columns on P&F charts, bricks on Renko charts, lines on Line-break charts, candles on Heikin ashi charts, and lines on Kagi charts. While the formula and reading of the indicators remain the same, they become more dynamic on these charts.