Customer Support : 020-61923200, [email protected] | Call and Trade : 020-61923220

Mansfield Relative Strength
#relativestrength #stockpicking
Inventor: George Mansfield; popularized by Stan Weinstein
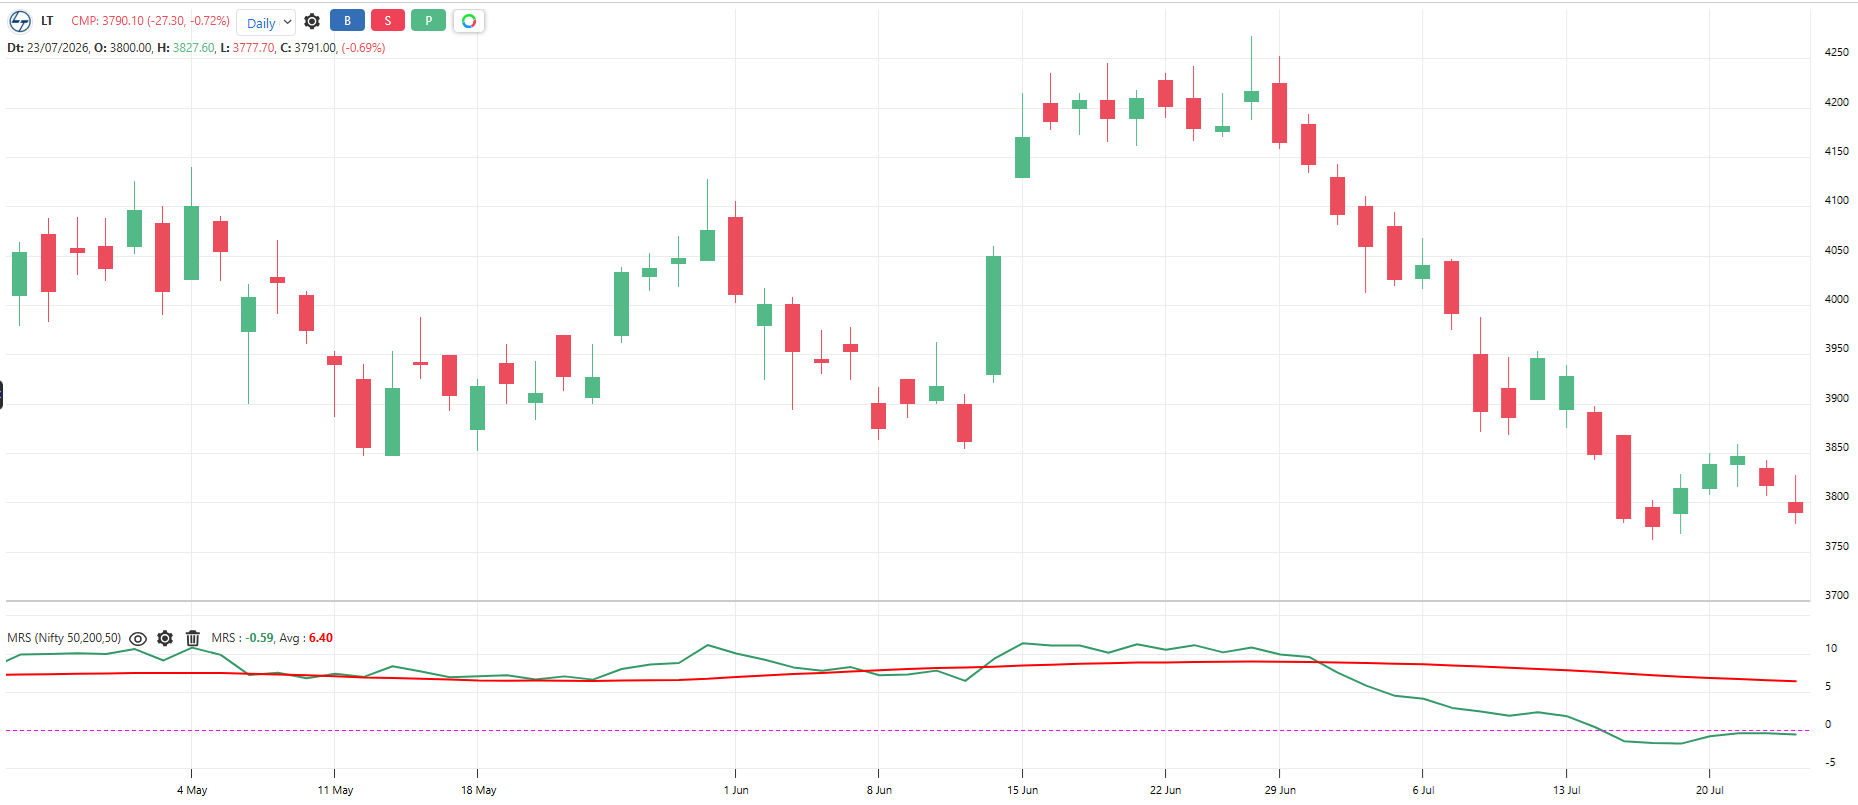
Made famous by Stan Weinstein. It compares a stock against its index: first the ratio (Stock / Index), then how far that ratio sits from its own long-term average, plotted around a zero line. Above zero means the stock is doing better than the market over the long run; below zero means worse. Note: this is comparative strength, not the RSI oscillator.
Default period: 52 weeks (200 days) for the ratio’s average; weekly chart
Line above zero indicates the stock is outperforming the index. Line below zero indicates it is underperforming.
Useful readings:
Crosses above zero: Stock starting to lead the market, classic Weinstein buy condition
Crosses below zero: Stock starting to lag the market, avoid or exit
Above zero and rising: Leadership strengthening, hold winners
Above zero but falling: Leadership fading, tighten stops
Stock breaks out AND line crosses above zero together: Highest quality breakout
In a falling market, stocks holding above zero are the first to rally
Objective rules:
Bullish: Mansfield RS crosses above zero.
Bearish: Mansfield RS crosses below zero.
Breakout filter: Take price breakouts only in stocks with Mansfield RS above zero
Portfolio rule: Hold only stocks with RS above zero; review any holding that drops below
Leader rule: Among similar setups, pick the stock with the highest rising RS
What makes it unique:
It judges a stock only by whether it beats the market, the single question that drives professional stock selection. Weinstein made its zero line the gatekeeper for every breakout.
The indicator table value in TradePoint & RZone also provides you with a list of all values of this indicator for any group of stocks. This will allow you to compare the readings of this indicator across different stocks.
This indicator is also available in the System Builder of RZone & TradePoint for all charting methods. Using the system builder, you can develop various strategies based on the different conditions already present in this indicator. Additionally, it can be used with other indicators or price patterns to develop effective trading strategies. For any group of stocks and market segments, you can scan and backtest stocks based on those strategies.