Customer Support : 020-61923200, [email protected] | Call and Trade : 020-61923220

Volar
#volatility #return #risk-adjusted #performance
Creator: Definedge
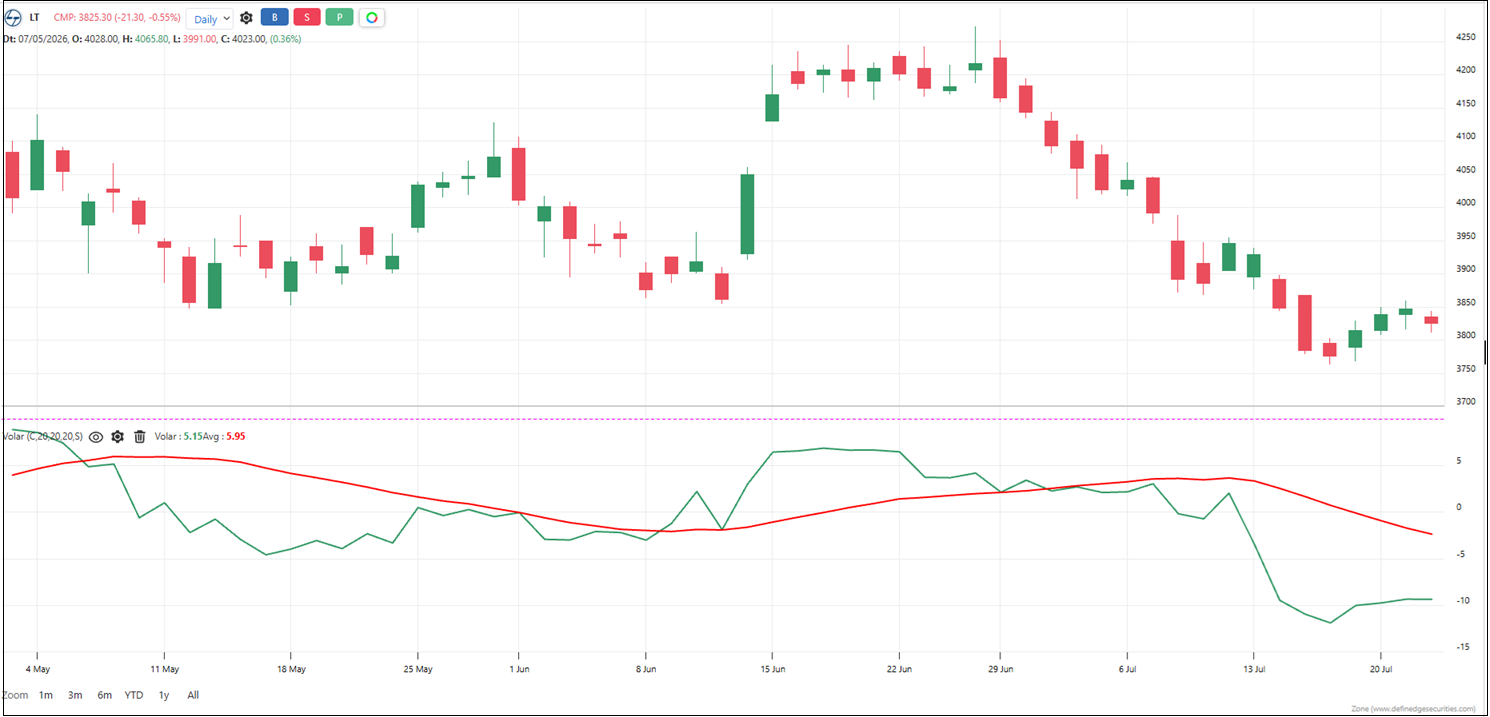
VOLAR (Volatility-Adjusted Return) tells you whether returns are strong or weak relative to the risk taken. A 10% return is amazing if volatility was 5% — you got paid well for the risk. The same 10% return is terrible if volatility was 50% — you took enormous risk for mediocre reward. VOLAR puts return in context by dividing it by volatility. High VOLAR means you’re getting paid well for the risk. Low VOLAR means you’re not.
Default period: 20
How to read it:
A single line with an average line running alongside it. When VOLAR is above the average, returns are strong relative to volatility — the risk-adjusted performance is good. When VOLAR is below the average, returns are weak relative to volatility — the risk-adjusted performance is poor. Above zero means returns are positive relative to risk. Below zero means returns are negative relative to risk.
Useful readings:
– Above average and rising — returns are growing faster than volatility. Risk-adjusted performance is improving. Very bullish.
– Above average and falling — returns are still good relative to volatility but weakening. The edge is fading.
– Below average and falling — returns are shrinking relative to volatility. Risk-adjusted performance is deteriorating. Very bearish.
– Below average and rising — returns are still poor relative to volatility but improving. The edge is returning.
– Crossing above average — risk-adjusted performance is turning positive. The market is starting to reward risk.
– Crossing below average — risk-adjusted performance is turning negative. The market is punishing risk.
– Above zero — returns are positive relative to risk. The trend is worth trading.
– Below zero — returns are negative relative to risk. The trend is not worth trading.
Use cases:
– Strategy filter: Only trade when VOLAR is above the average. That means the market is rewarding risk. When VOLAR is below average, step aside — the market is punishing risk-takers.
– Position sizing: Larger positions when VOLAR is high (you’re getting paid well for risk). Smaller positions when VOLAR is low (you’re not).
– Trend quality check: Rising VOLAR means the trend is healthy — returns are growing faster than volatility. Falling VOLAR means the trend is deteriorating — volatility is eating into returns.
– Reversal warning: When price makes a new high but VOLAR doesn’t, the new high is coming with excessive volatility. The trend is becoming risky and may reverse.
Objective rules:
– Go long when VOLAR crosses above the average line.
– Go short when VOLAR crosses below the average line.
– Exit when VOLAR crosses back through the average in the opposite direction.
– Avoid trading when VOLAR is below zero — returns are negative relative to risk.
– Use VOLAR as a filter, not a standalone signal. Combine with your own entry triggers.
What makes it unique:
Most return indicators treat all returns equally. VOLAR knows that a 10% return with 5% volatility is a different animal than a 10% return with 50% volatility. By dividing return by volatility, VOLAR gives you a risk-adjusted view of performance. It answers: “Am I getting paid enough for the risk I’m taking?” That’s the question every trader should ask before entering a trade.
The indicator table value in TradePoint & RZone also provides you with a list of all values of this indicator for any group of stocks. This will allow you to compare the readings of this indicator across different stocks.
This indicator is available in the System Builder on RZone & TradePoint for all charting methods. Using the system builder, you can develop various strategies based on the different conditions already present in this indicator. Additionally, it can be used with other indicators or price patterns to develop effective trading strategies. For any group of stocks and market segments, you can scan and backtest stocks based on those strategies.
Click here to learn more about the indicator.
The indicator is applicable to all types of charting. It is calculated based on the number of columns on P&F charts, bricks on Renko charts, lines on Line-break charts, candles on Heikin-Ashi charts, and lines on Kagi charts. While the formula and interpretation of the indicators remain the same, they become more dynamic on these charts.