Customer Support : 020-61923200, [email protected] | Call and Trade : 020-61923220

New Feature Releases in Tradepoint Desktop
2nd June 2026:
1. Dynamic Ultimate Matrix:
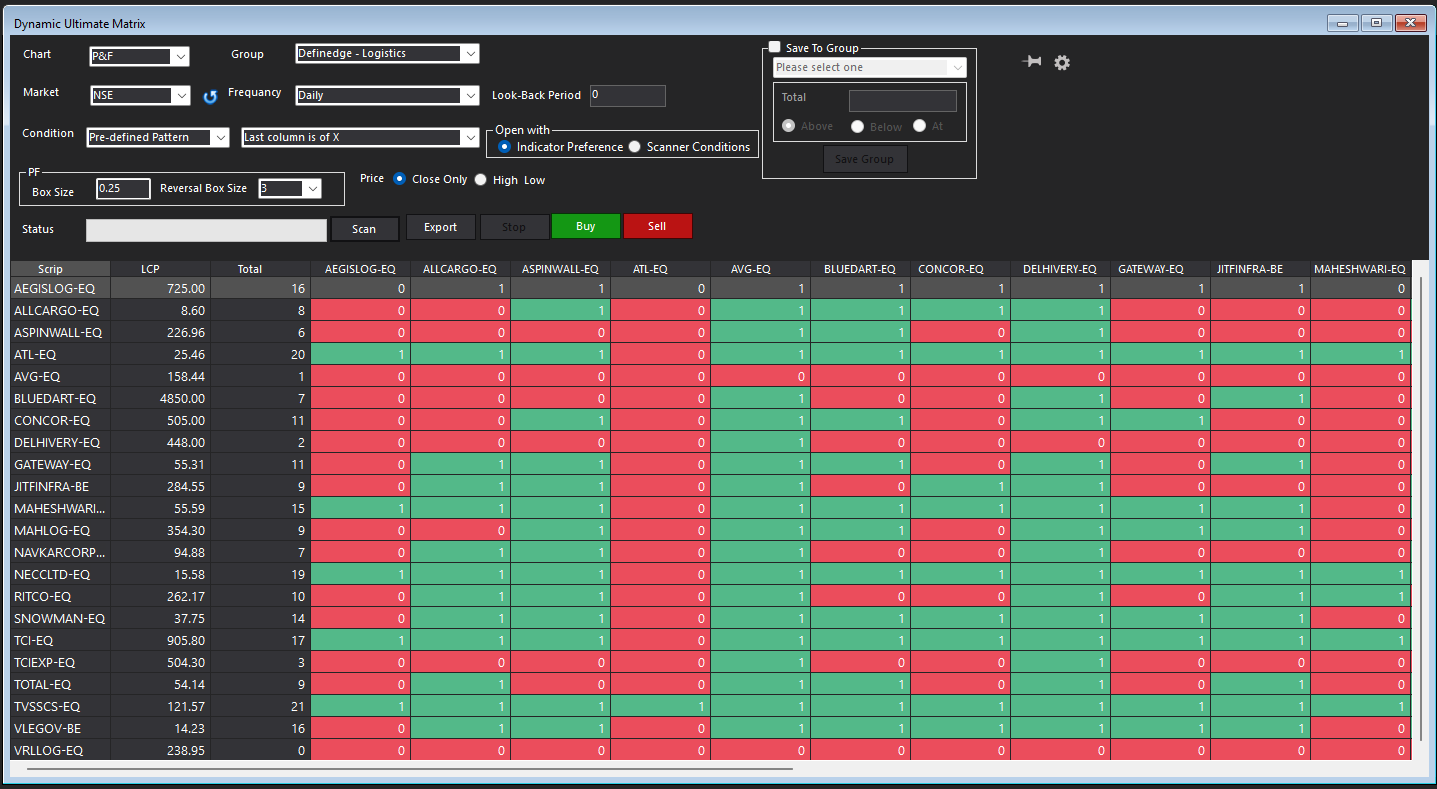
Introducing the Dynamic Ultimate Matrix. This allows you to compare the relative strength of the scrips within a group using customised conditions based on charting types, timeframes, and selected strategies. Scores indicate whether a stock is outperforming (score of 1) or underperforming (score of 0) relative to others in the group, offering dynamic insights into performance. It supports user-defined trading strategies across P&F, Renko, and Ratio charts, with flexibility to apply predefined, public or popular strategy conditions for selection criteria.
2. Indicator & System builder conditions:
A. Volatility Cycle Indicator and its SB conditions for OHLC chart
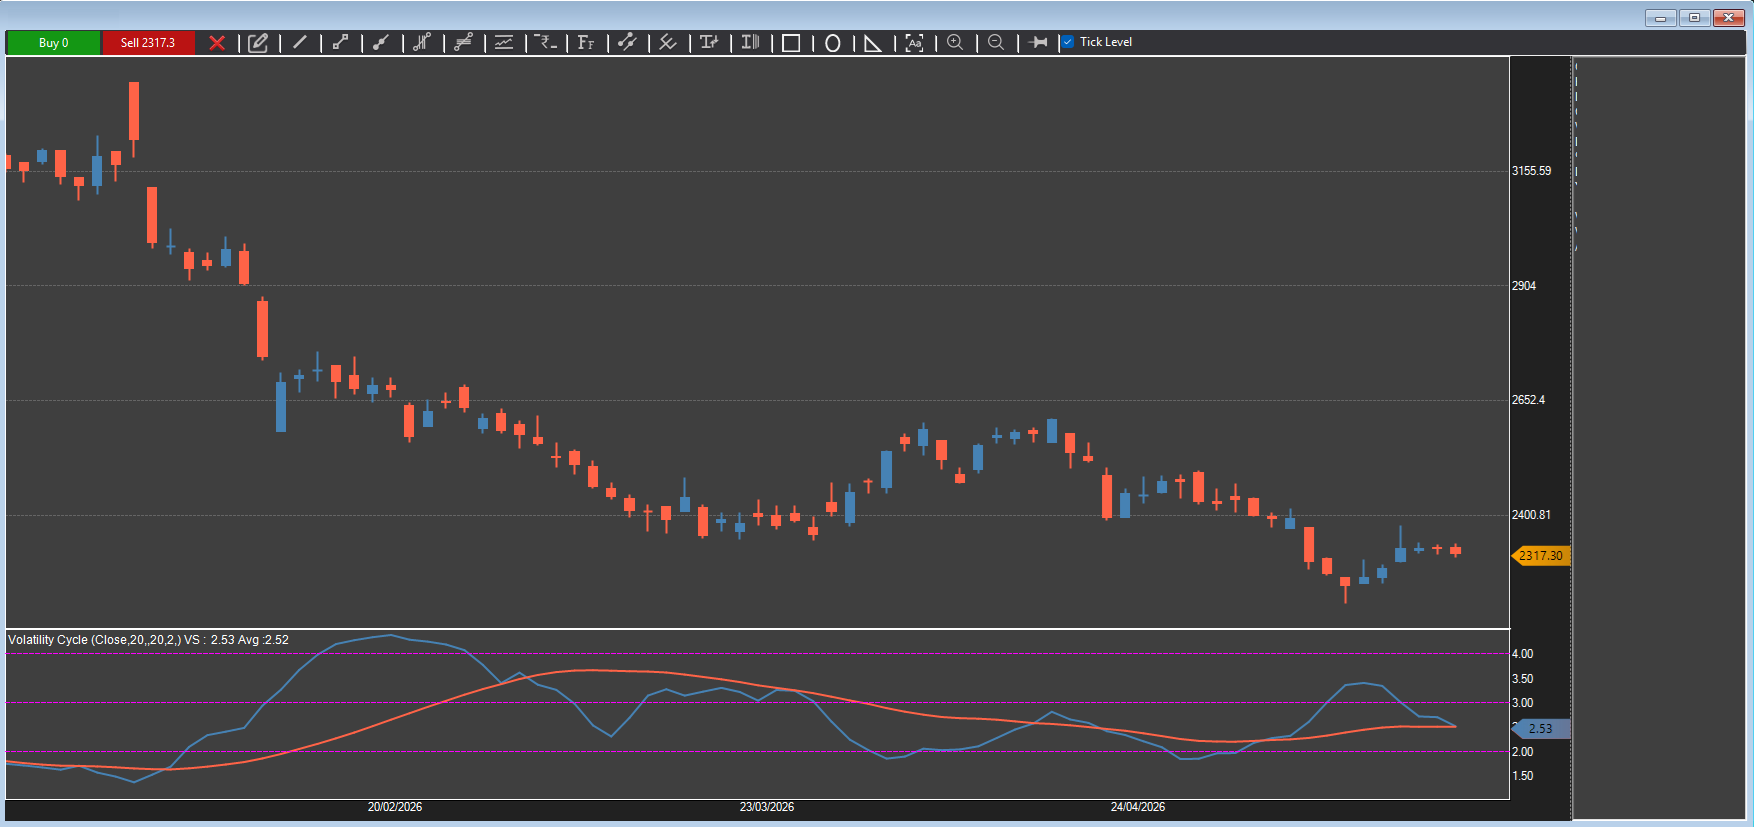
The Volatility Cycle can read the market’s changing cycles from quiet consolidation to explosive trend. This indicator blends Average True Range (ATR) and Standard Deviation to highlight phases of expanding and contracting volatility.
When the Volatility Cycle stays below its moving average, it signals a low-volatility environment where prices often move in a range, making it suitable for short-volatility or mean-reversion strategies. However, the moment it crosses above the average, it warns that volatility is expanding and a directional, trending move could be on the cards.
For traders, combining the Volatility Cycle with a trend-following indicator adds an extra layer of confirmation, helping avoid false breakouts and align entries with periods when momentum and volatility are working in the same direction.
This can be applied on OHLC charts. Open the OHCL Chart > Add Indicator > Volatility Cycle
Watch the video here https://www.youtube.com/watch?v=QoKF8uV_EZs&t=3s
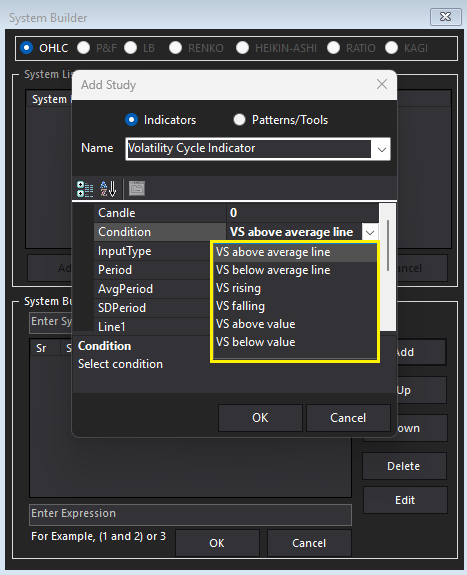
System Builder conditions of Volatility Cycle Indicator
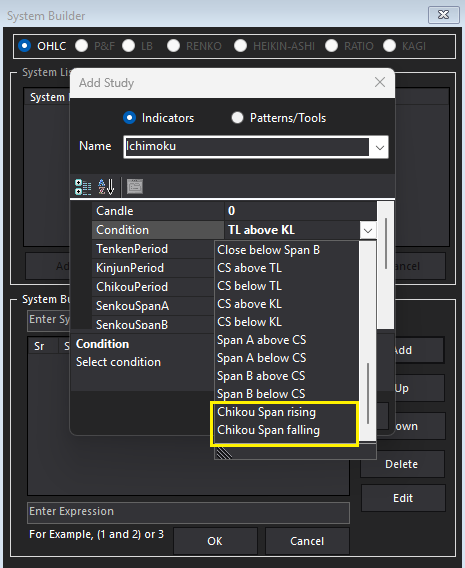
B. System Builder conditions of Ichimoku indicator for all charts:
• Chikou Span rising
• Chikou Span falling
08th Jan 2026:
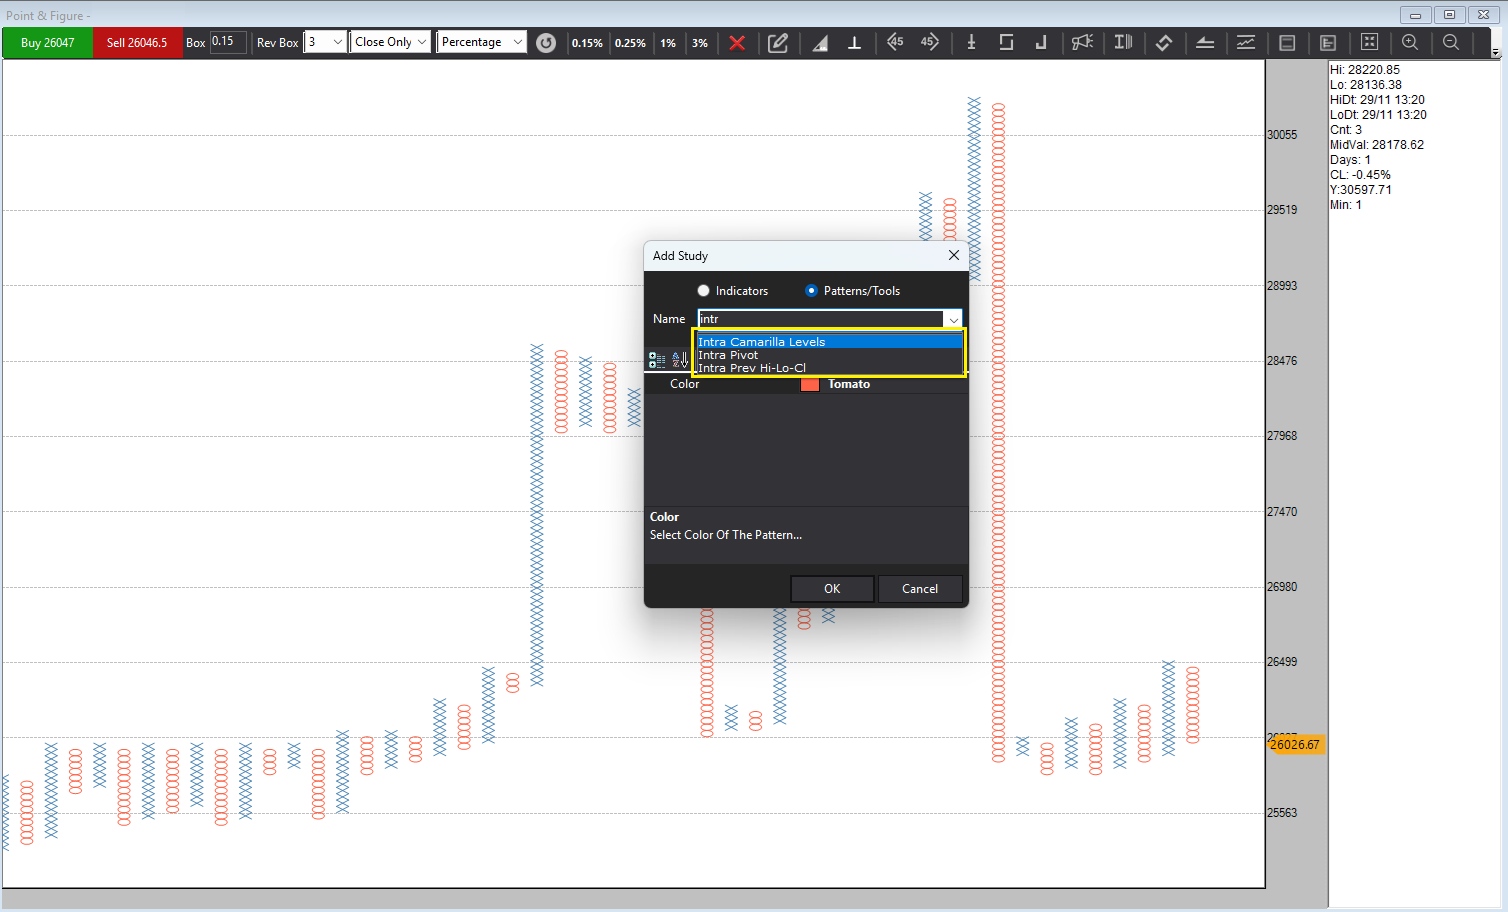
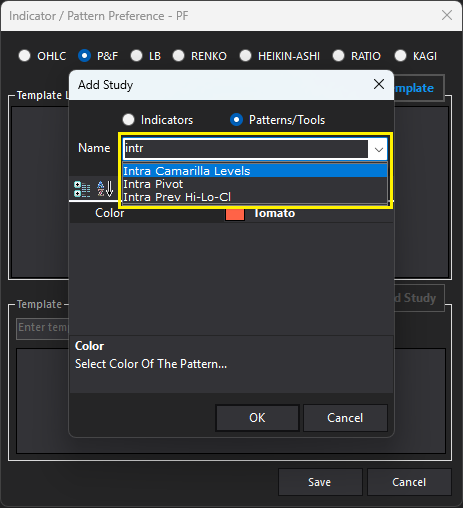
1. All the intraday tools are now conveniently available under Add Study > Patterns, making chart analysis faster and more efficient.
Users can also save a custom template of these intraday tools by going to Settings > Indicator/Pattern Preference and create the template by adding the tools. It will enable quick access on charts and ensure a smoother, more consistent trading workflow.
2. D Scalper :
- Chart auto-saves along with user preferences.
- Single commentary added for all charts (CE, Future, PE).
- Timeframe can be changed by right-clicking on the chart via the View menu.
- Impact price support available for both LMT and MKT order types.
- Auto-slicing enabled.
- Order book and trade book areas are resizable.

16th Dec 2025:
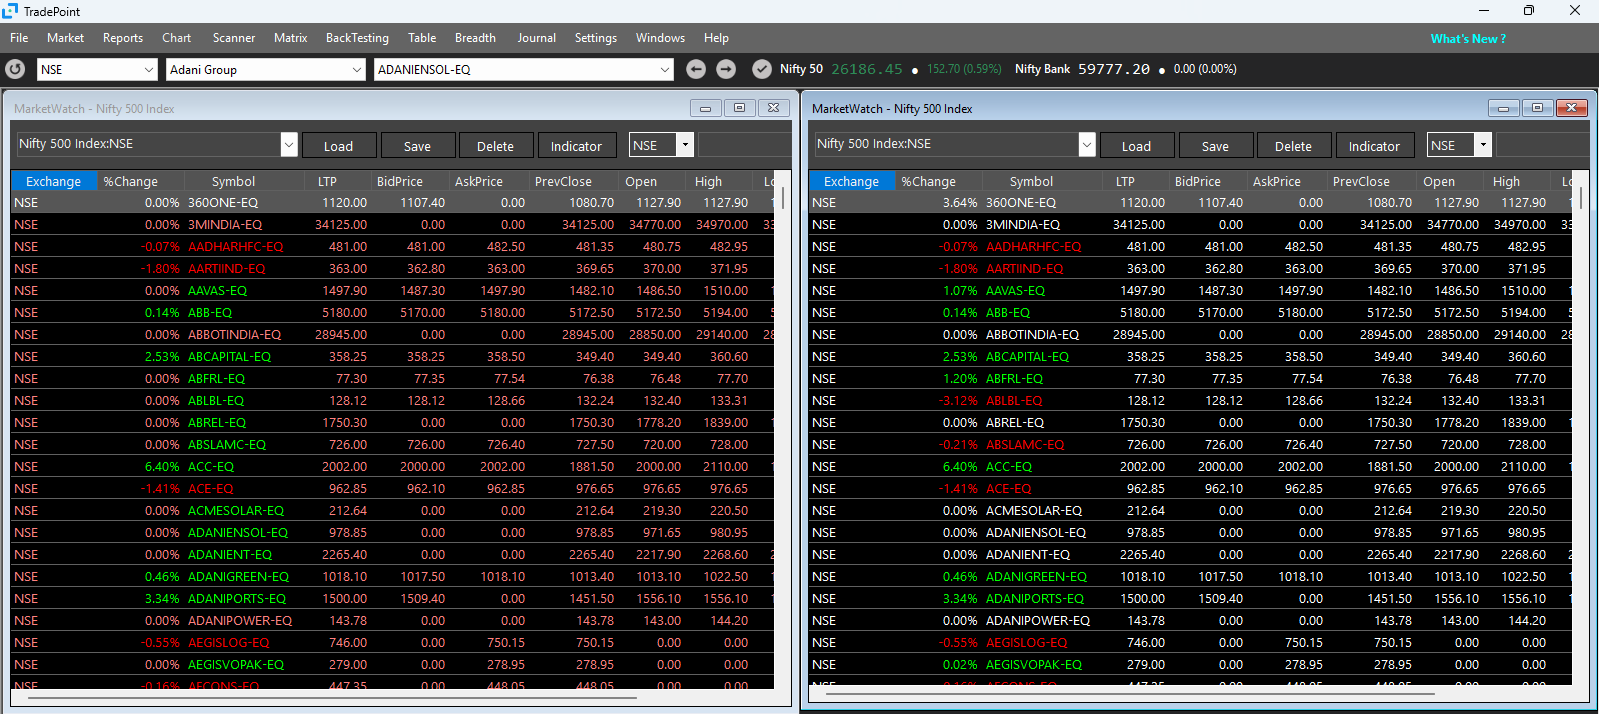
1. Enable Market Watch Color Style for Back Color and Fore Color.
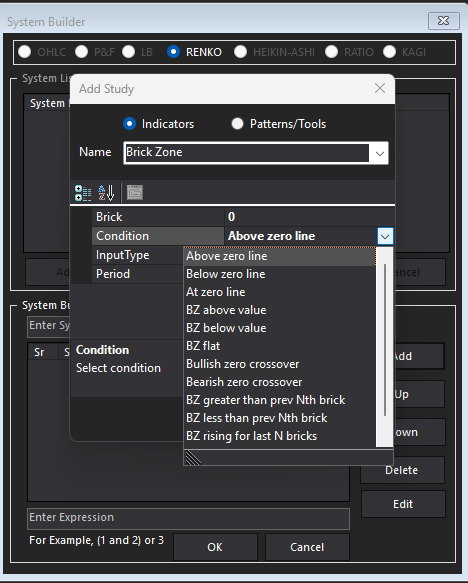
2. SB conditions of the Brick Zone Indicator for a Renko chart.
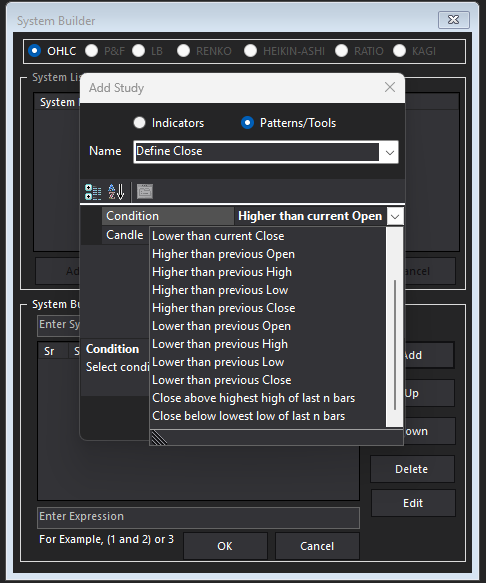
3. SB Conditions for Price in OHLC System.
Close above highest high of last n bars
Close below the lowest low of the last n bars
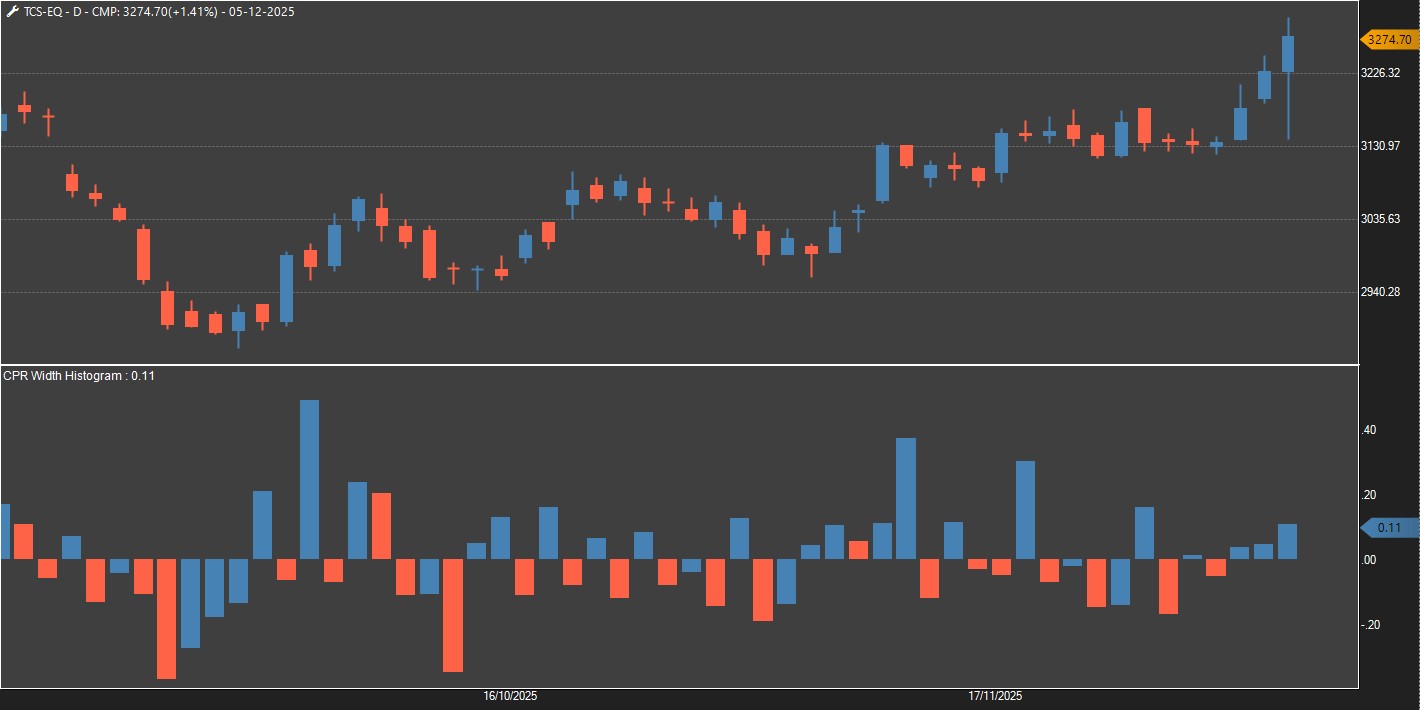
4. CPR Width Histogram Indicator and SB conditions on the OHLC chart.
CPR Width Histogram gives a deeper visual insight into market energy.
A narrow CPR accompanied by rising histogram bars indicates compression with increasing participation or volatility, signalling a high-probability trending move. Conversely, a wide CPR with declining histogram bars suggests a lack of momentum, often leading to sideways action.
When price opens above the CPR with strong histogram expansion, bullish continuation becomes more reliable; similarly, an open below the CPR with expanding histogram favours bearish control.
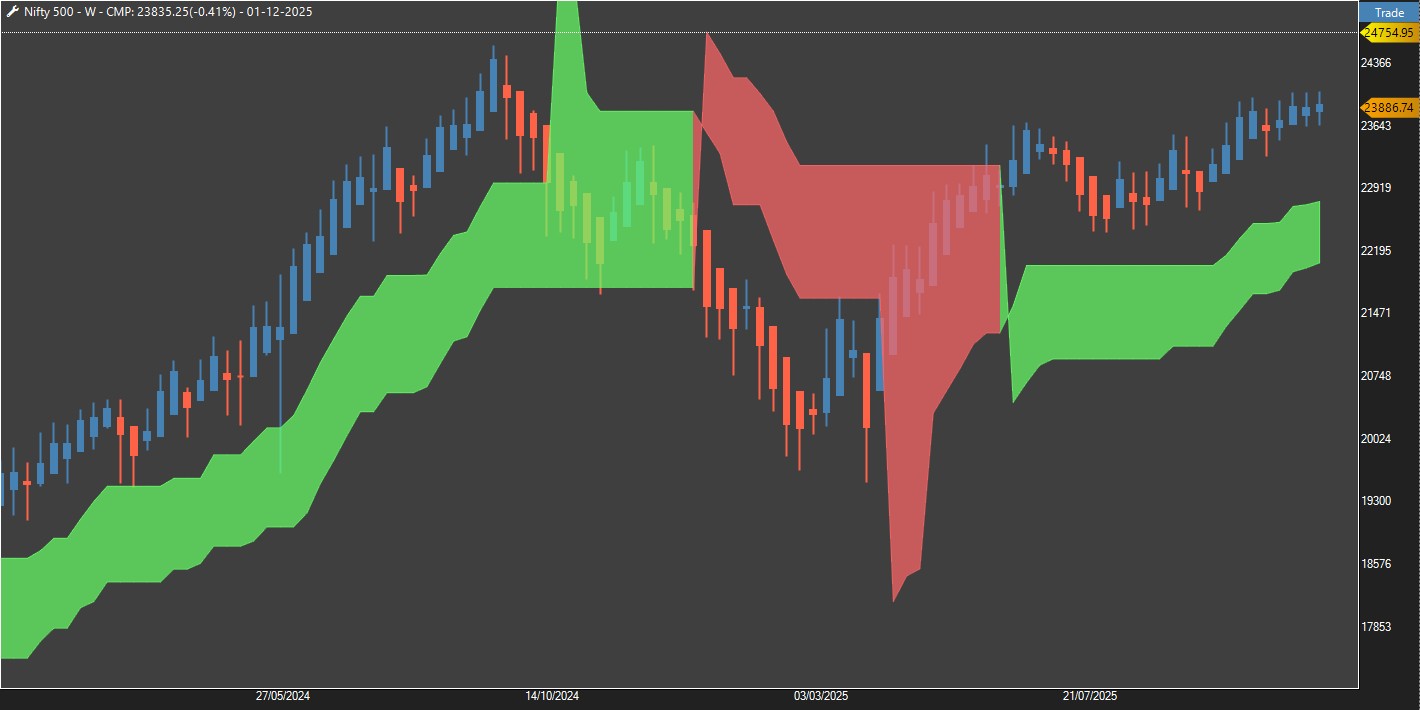
5. D Smart Indicator and SB conditions on the Heikin-Ashi chart.
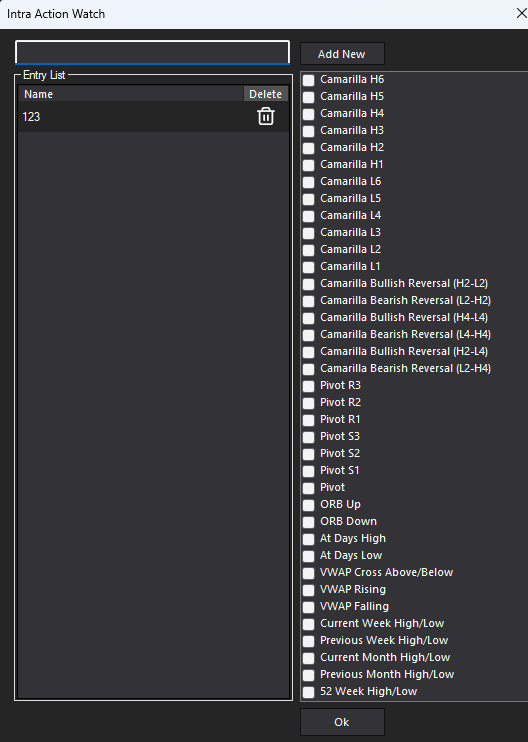
6. Enable saving entries of conditions for Intraday action watch.
Intraday Action watch comes with profile saving with the entries as per user preference.
7. D Scalper on the market menu.
D Scalpers are lightning-fast decision makers and execute trades in the blink of an eye, often within seconds.
In options trading, a D scalper must stay hyper-alert, respond instantly, and act with precision to capture even the smallest movements. To empower such high-intensity trading, we are introducing the D Scalper Window, a streamlined interface designed for single-click execution based on the prevailing trend. It helps traders enter or exit positions instantly, supporting the agility and accuracy that scalping demands.
Markets > D Scalper
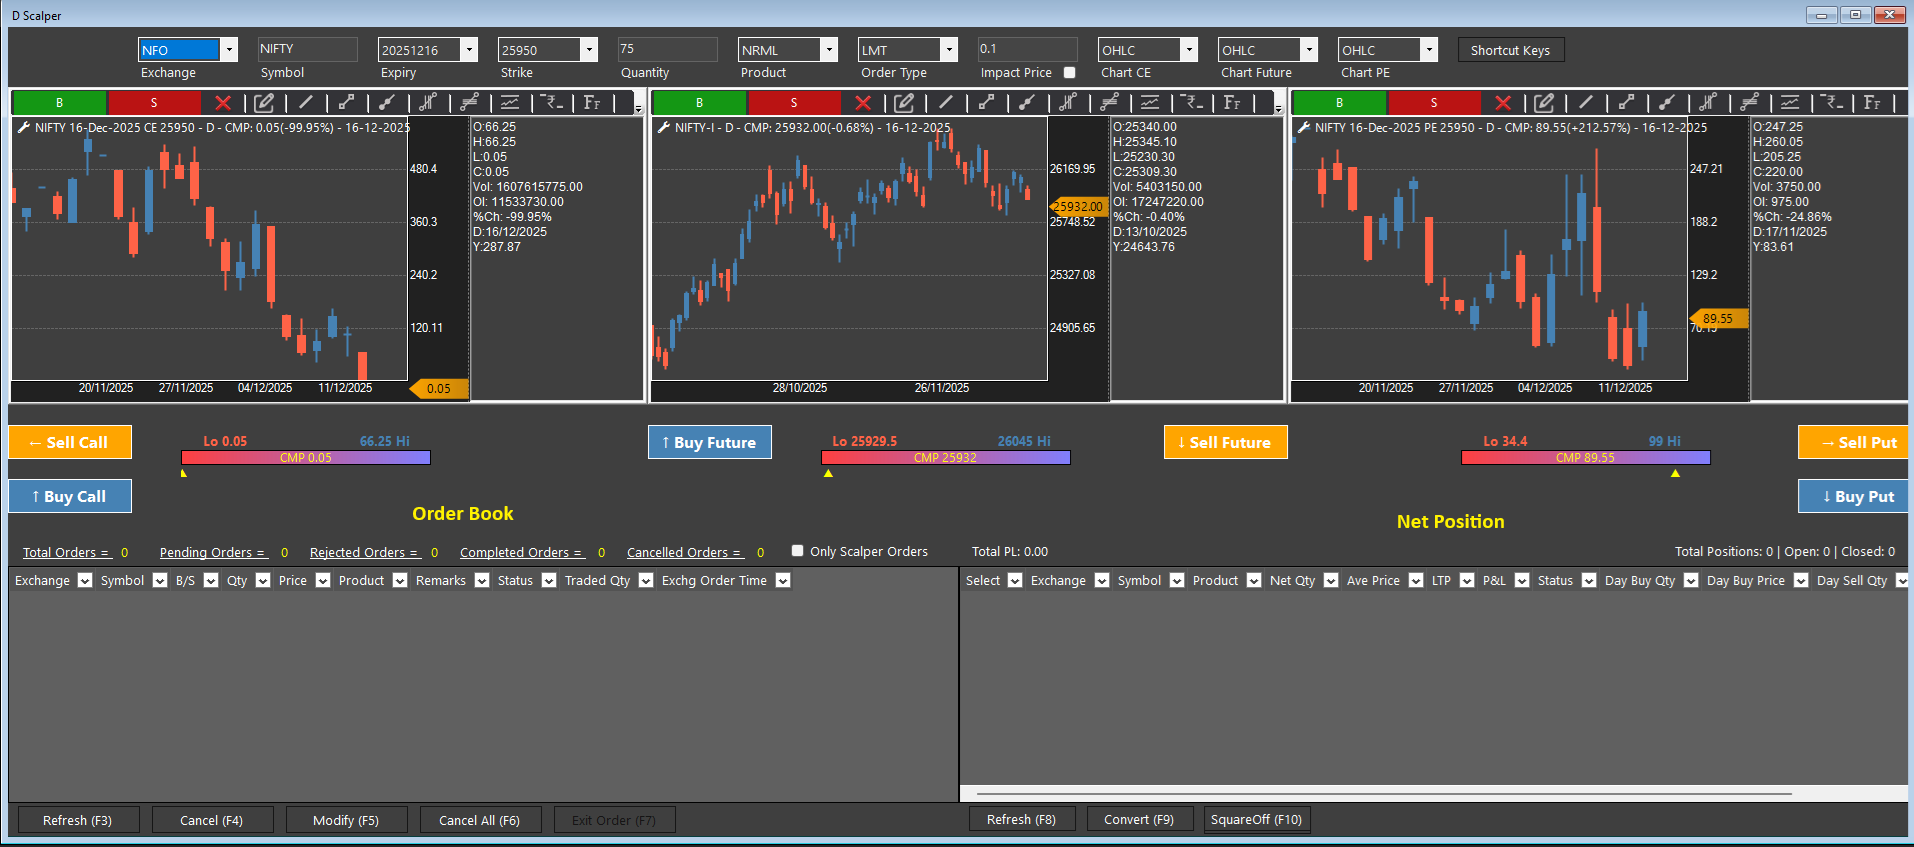
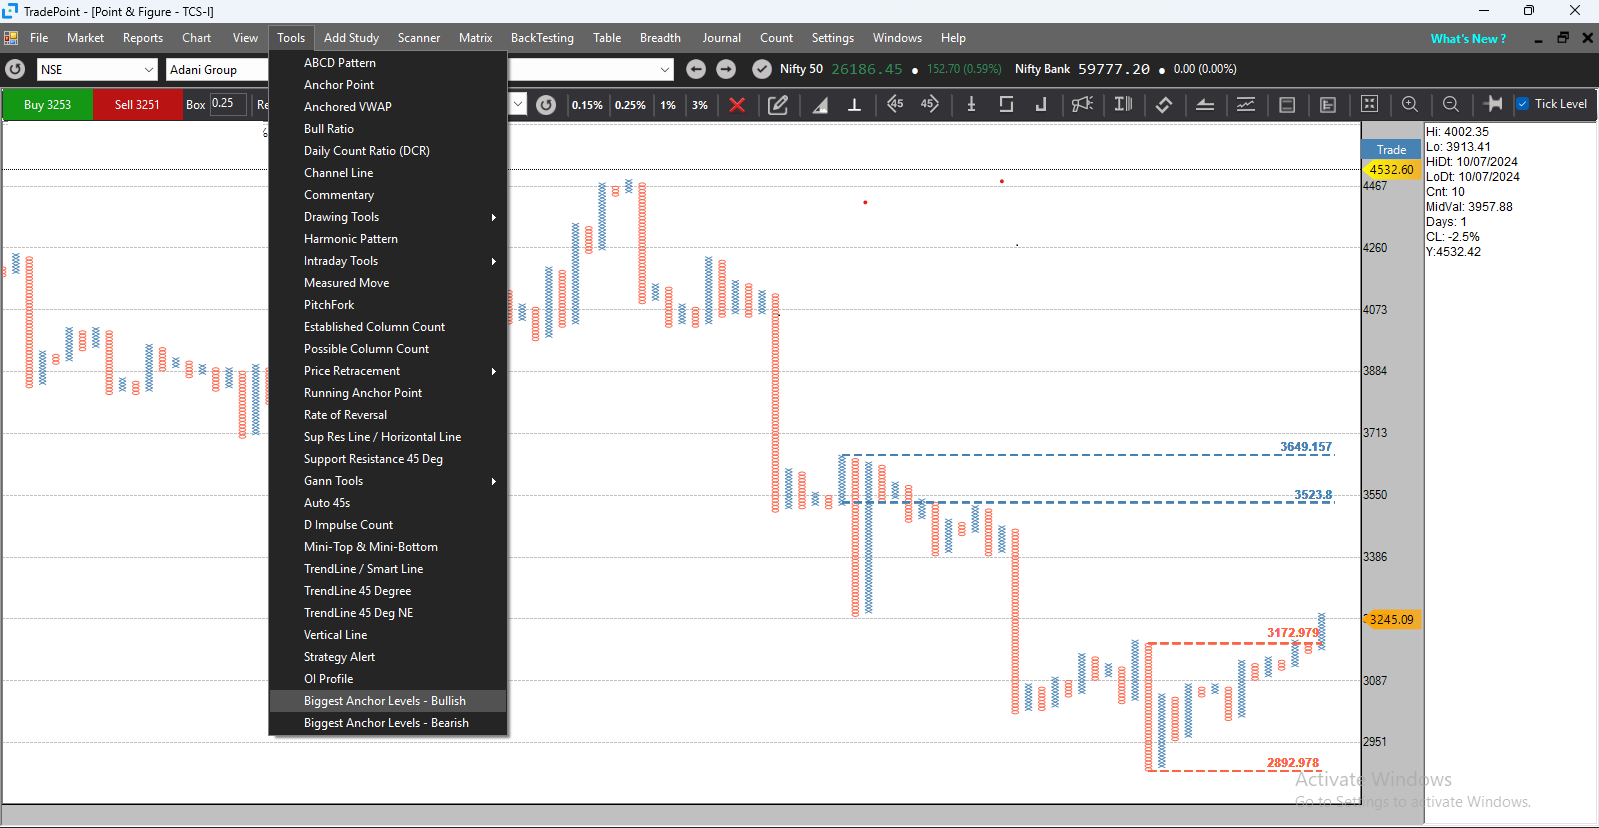
8. Biggest anchor column in tool and SB condition for PF chart .
Biggest Anchor Levels - Bullish
Biggest Anchor Levels – Bearish
31st Oct 2025:
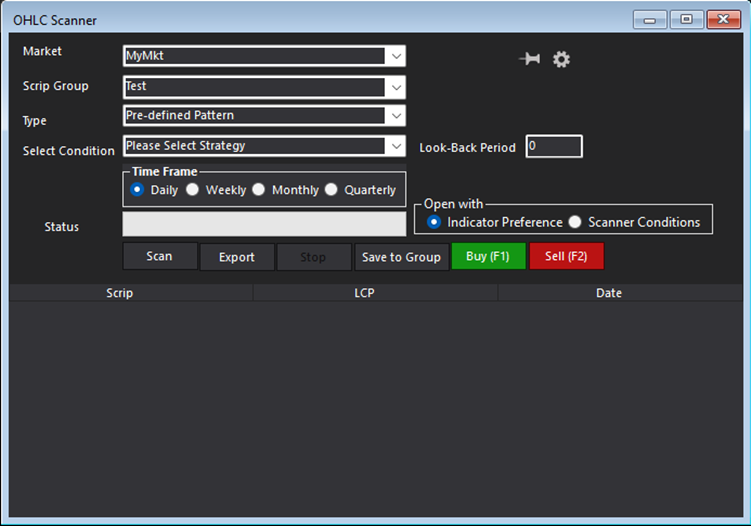
1. Manage MyMkt Groups and Scan the Patterns
MyMkt is a unique feature of TradePoint, allowing you to download data for any global market index, stocks, commodities, or forex, and upload it to TradePoint. Check how to upload data
Taking a step further, you can group the stocks in MyMkt.
Go to Settings > Manage Data > Group Manager > MyMkt
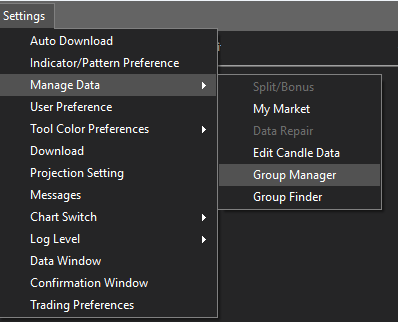
Additionally, you can scan these MyMkt Groups in any scanner on TradePoint.
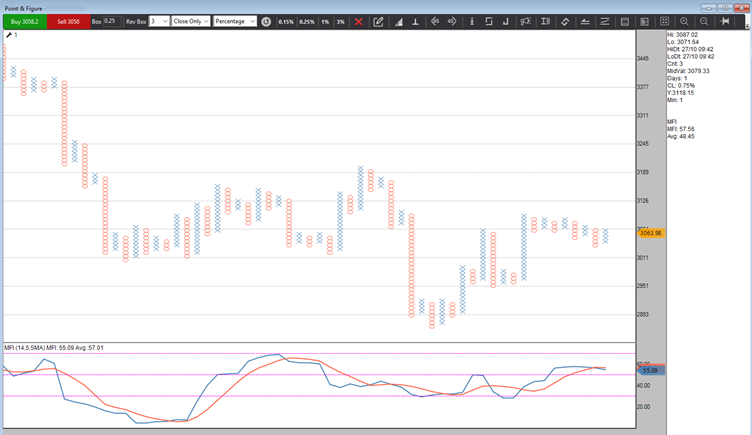
2.Added Average line and System builder conditions in Money Flow Indicator (MFI) for OHLC, Point & figure, Renko and HA.
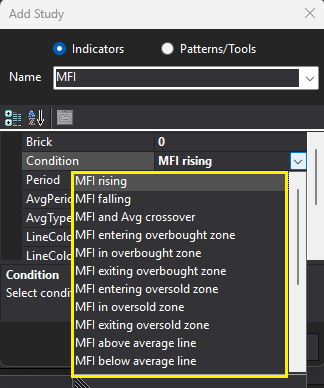
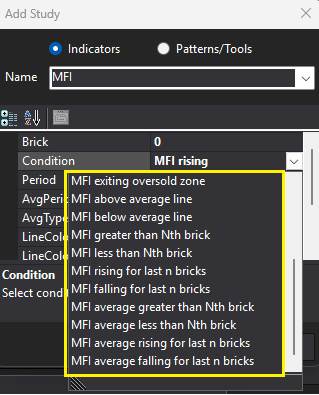
System Builder conditions:
09th Sept 2025:
A. Order Type
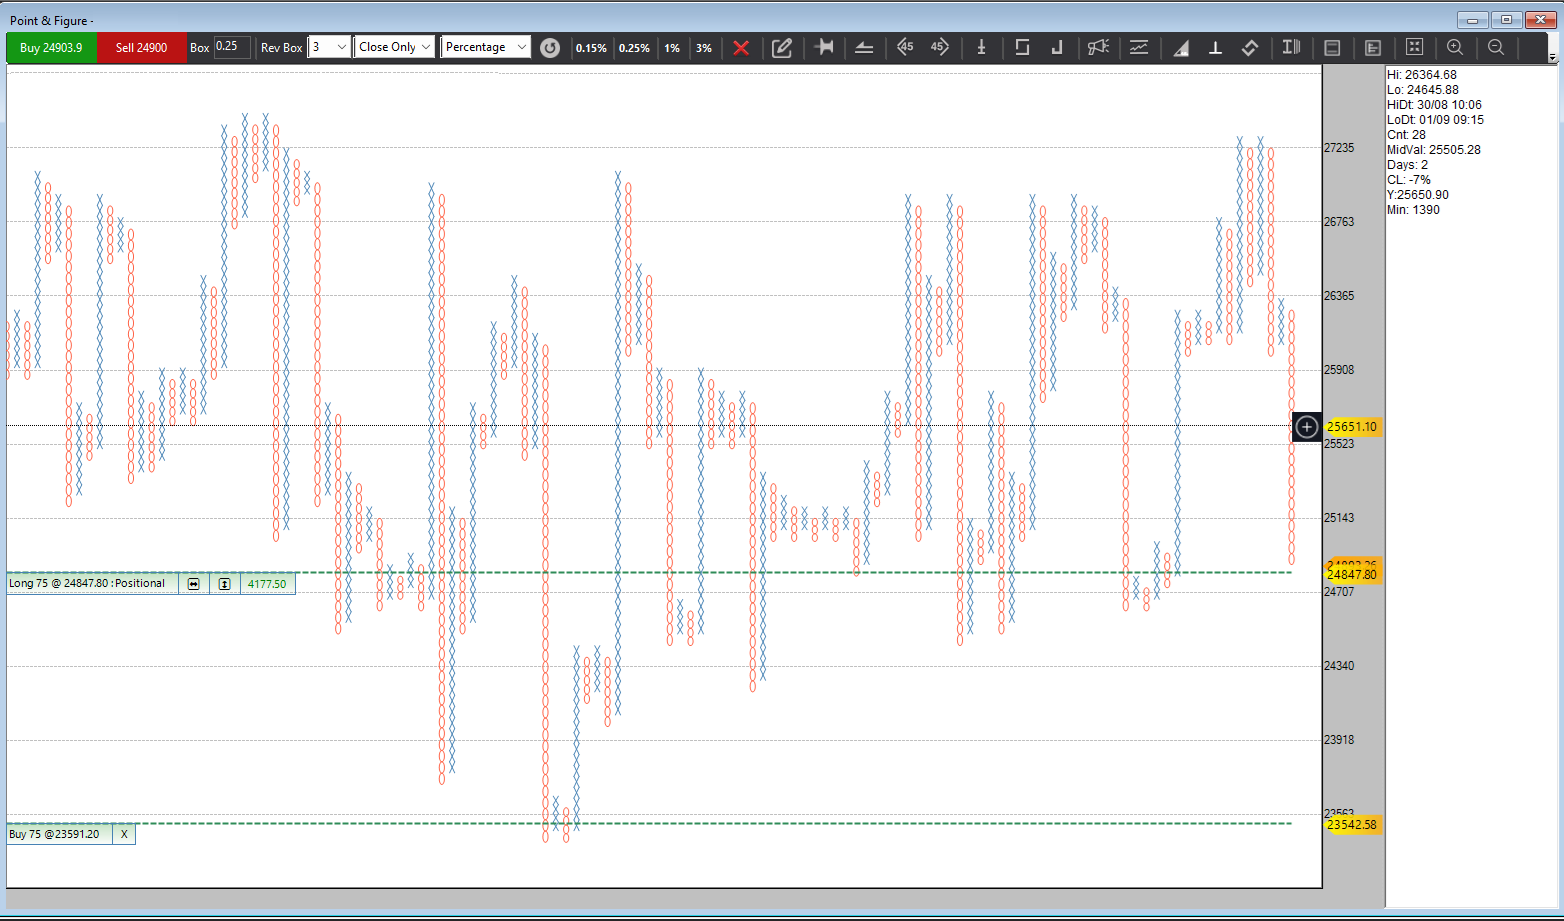
1.Order From Chart for Point & Figure ,Heikin Ashi and Renko chart.
The Open Positions can be viewed directly on the chart with the horizontal line.
To activate and deactivate the feature, go to Settings> Trading Preference and turn the three options to TRUE
a. Trade from Chart
b. Show Order Book
c. Show Position Book


B. New Indicator's & SB conditions
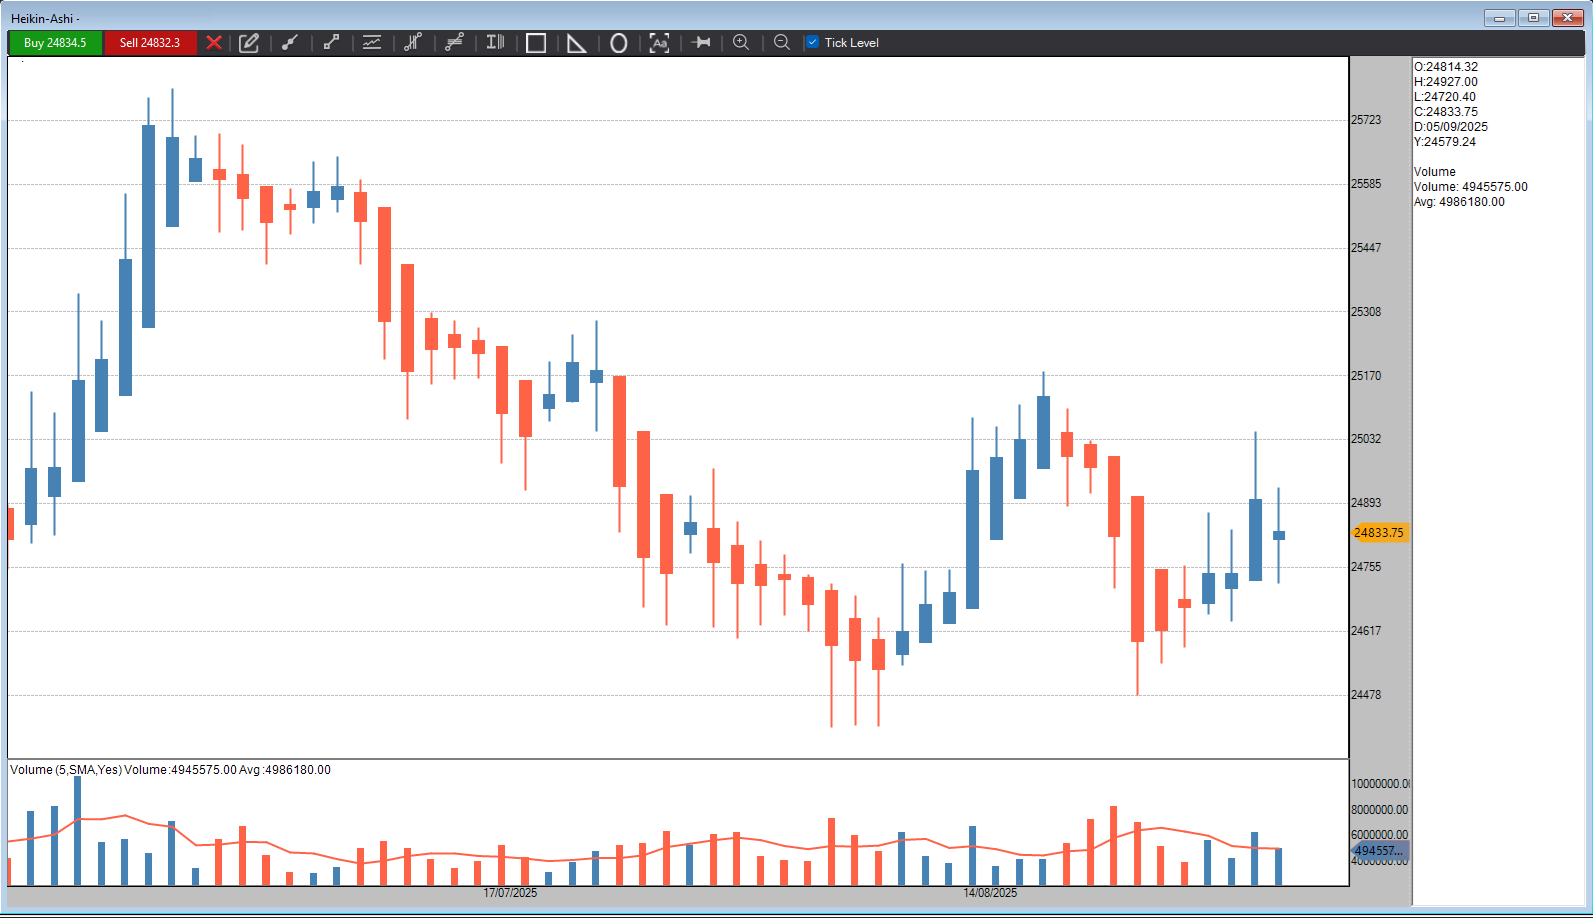
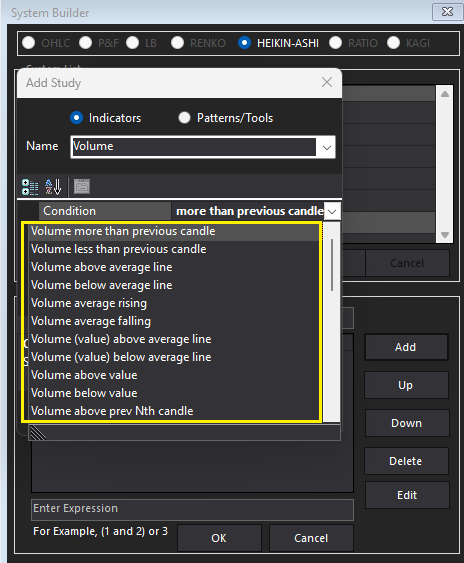
1. Volume indicator with SB for Heikin chart.
C. Add only System Builder conditions in below indicators
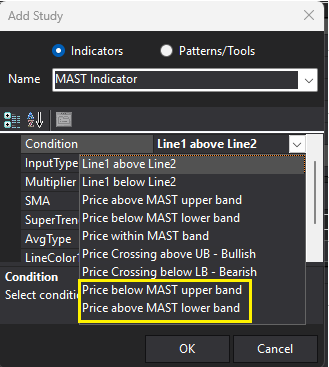
1. System builder conditions of MAST indicator for all charts.
2. System Builder conditions in Brick Count Indicator

D. New Patterns & SB conditions
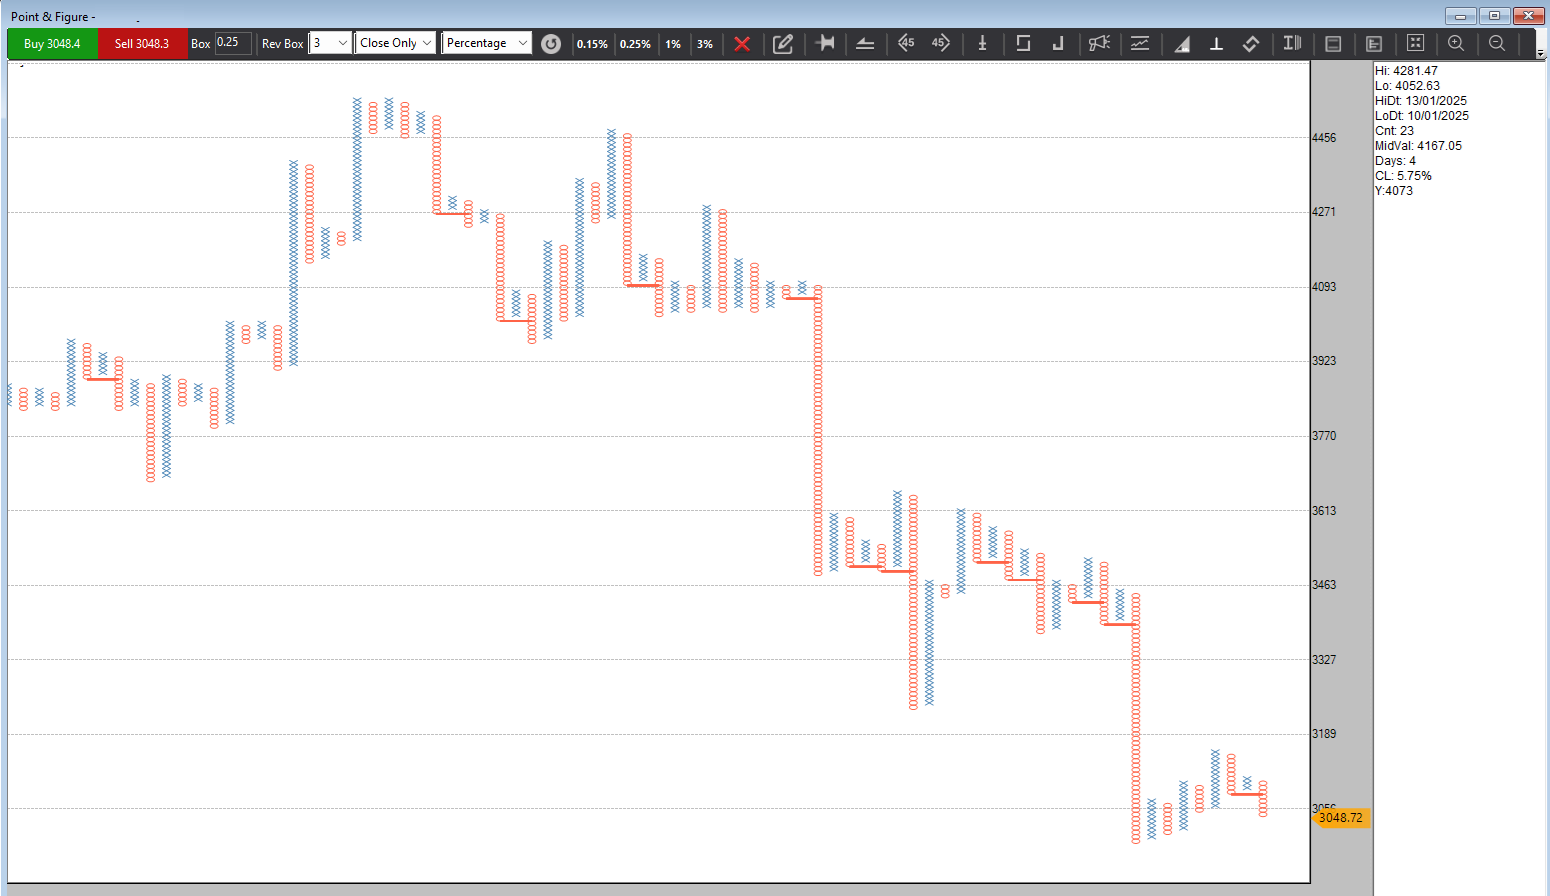
1.Master AFT - Bullish Master AFT and Bearish Master AFT pattern for P&F chart.
Bullish Master Anchor Column Follow Through (AFT) is the immediate column of follow-through to indicate the possibility of DTB.
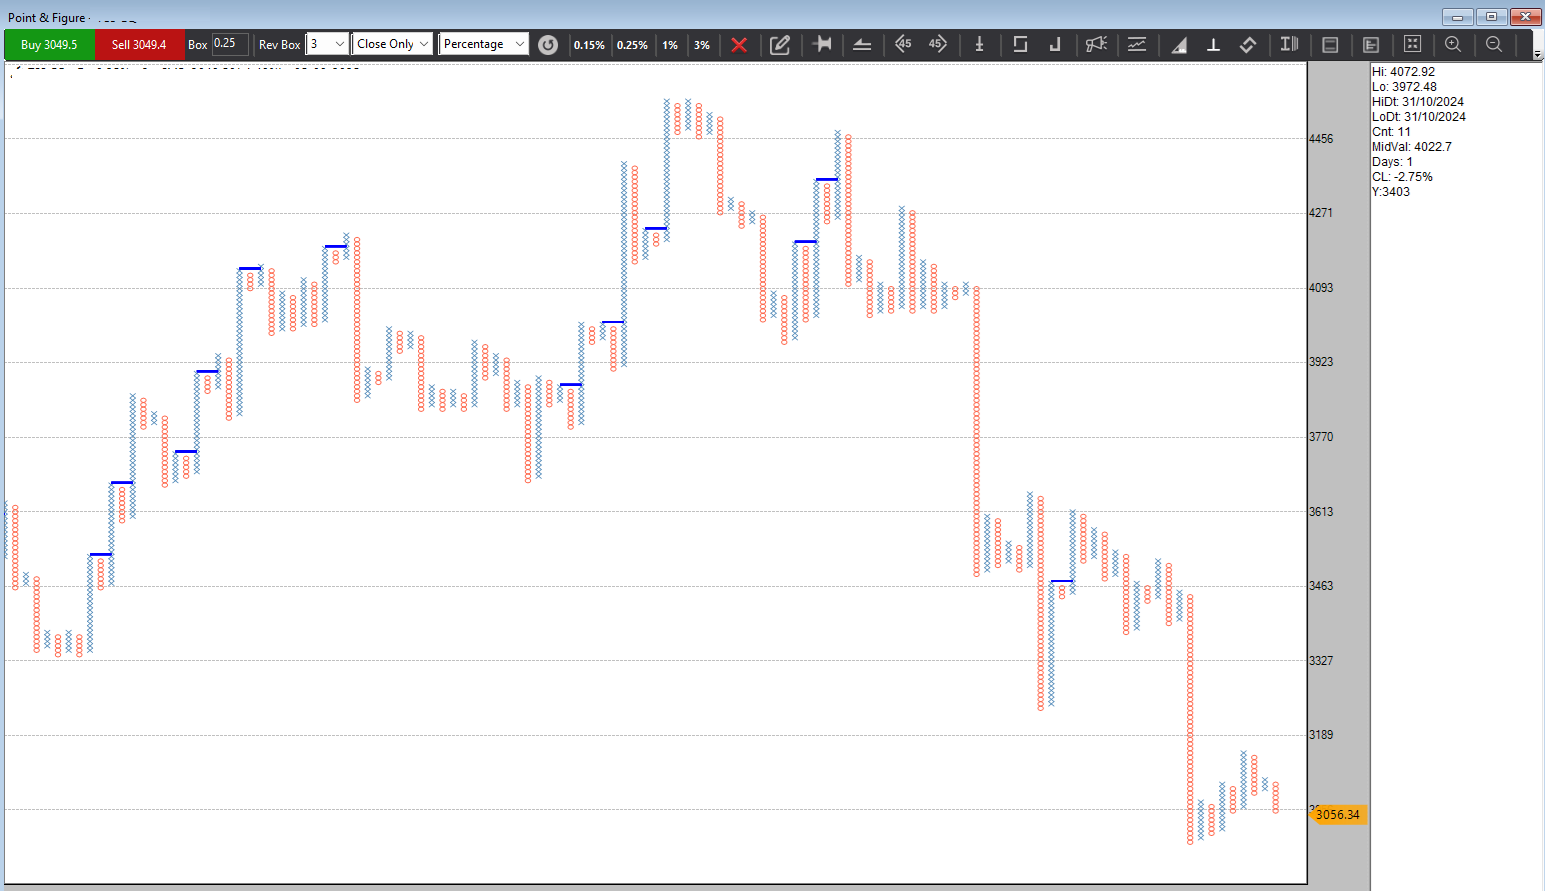
Bearish Master Anchor Column Follow Through (AFT) is the immediate column of follow-through to indicate the possibility of DBS.
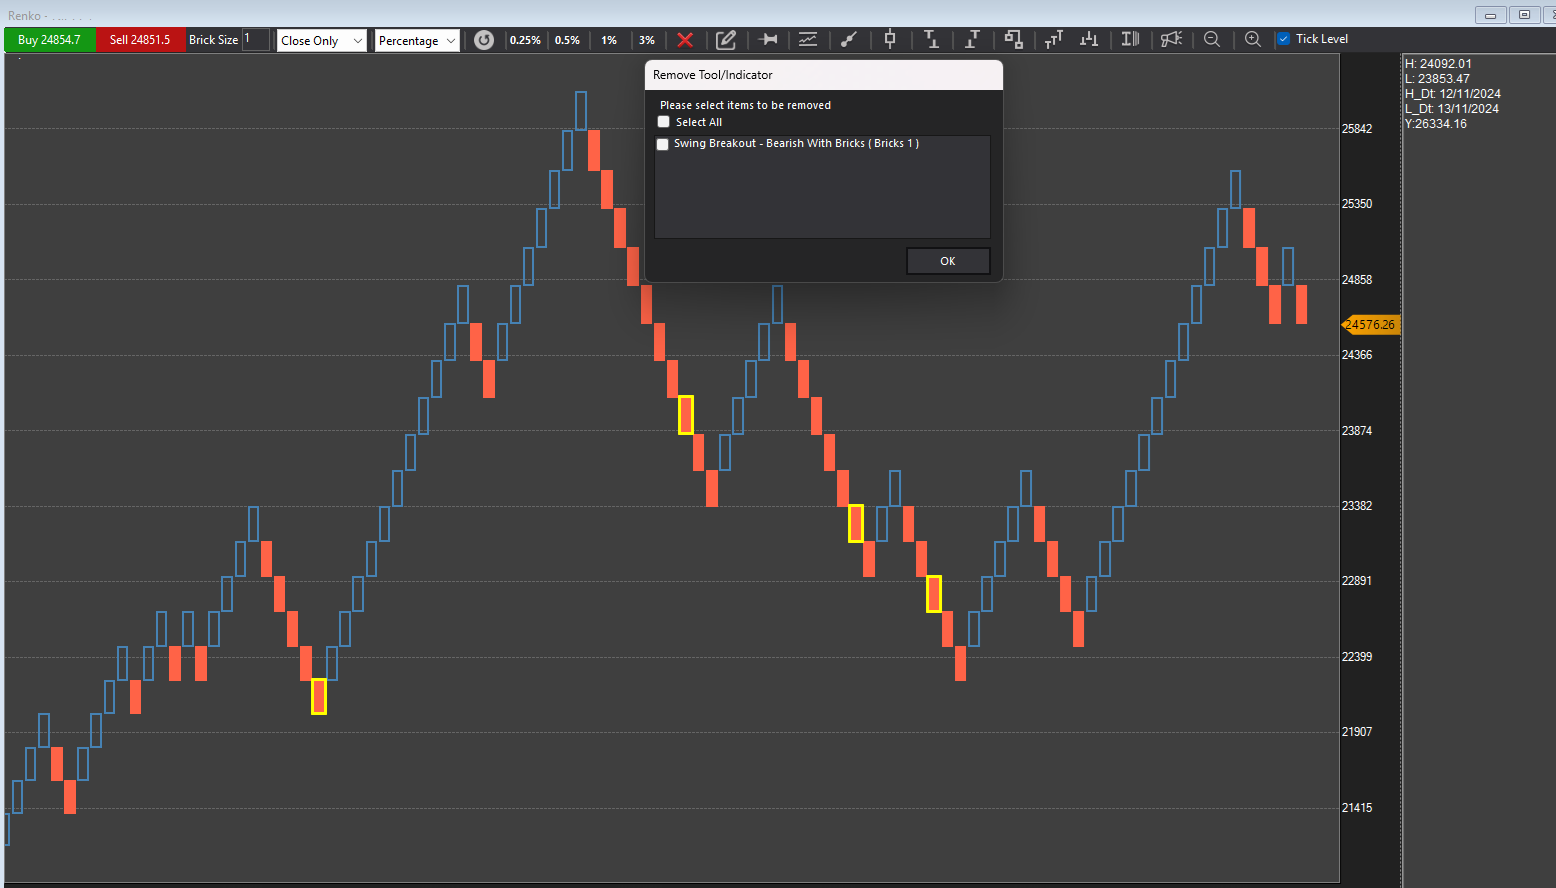
2. Swing Breakout Bullish with Bricks & Swing Breakout Bearish with Bricks for Renko chart
a. N Bullish Brick After Swing Breakout Bullish

b. N Bearish Brick After Swing Breakout Bearish
E. Other Features:
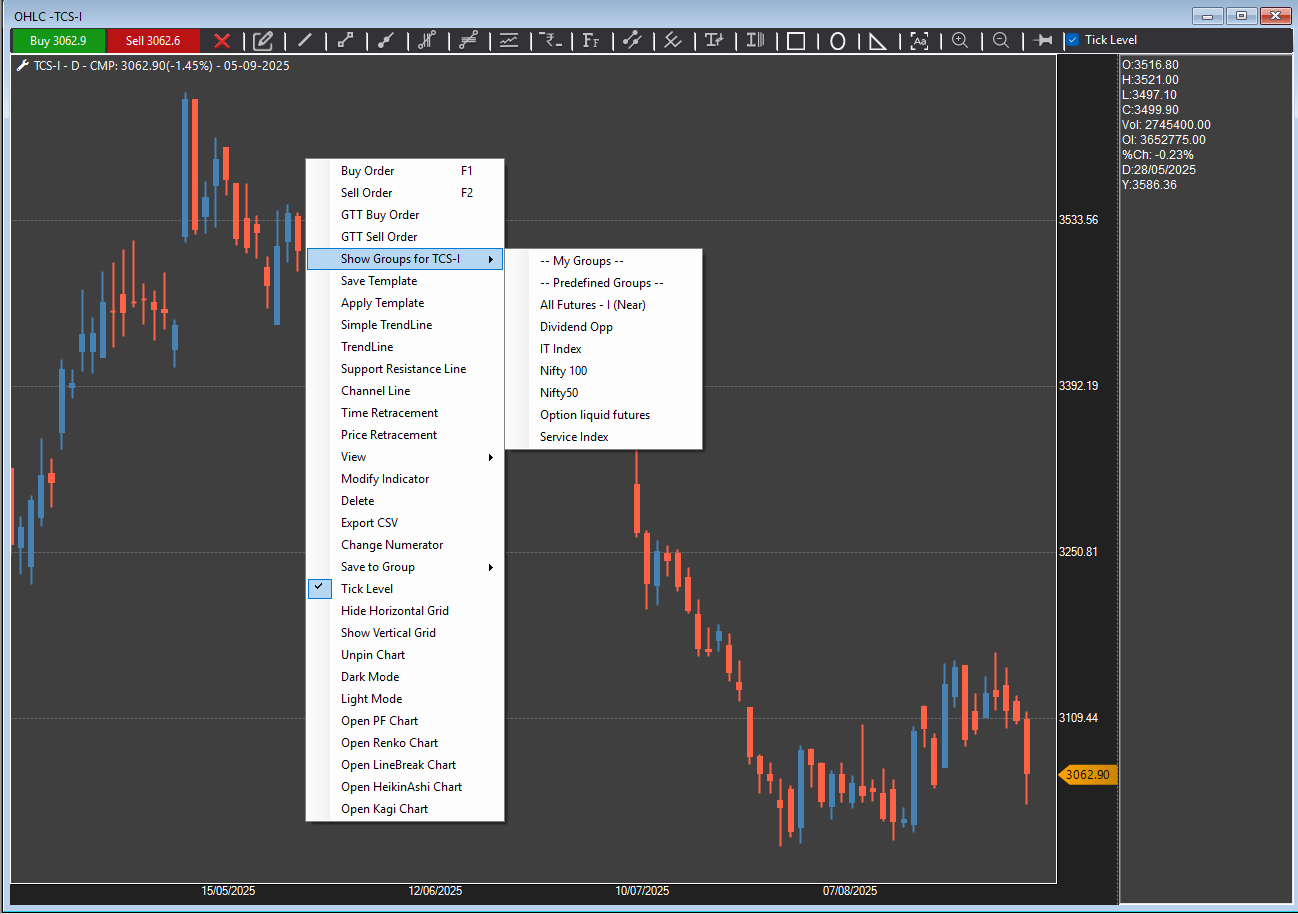
1. Add the Group Finder option on right-clicking for all stock
Path: Open any chart—> right click on chart—> Check Show Group option
This feature identifies the stock with the greatest potential to influence the group's performance.
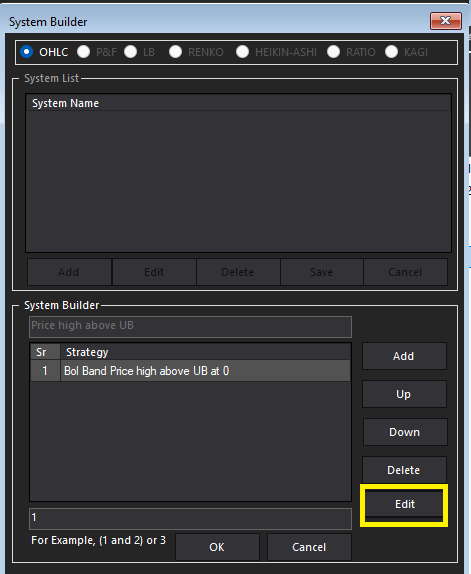
2. Edit button in System builder for all charts.
Path—> Back testing --> System builder
This feature helps to edit the indicator in the system builder.
3. Implement Sorting Functionality in Position Tracker
Path-->Journal-->Position Tracker
4. Add Renko RS option in Multi-chart scanner
Path—>Smart scanner-->Multi-chart scanner

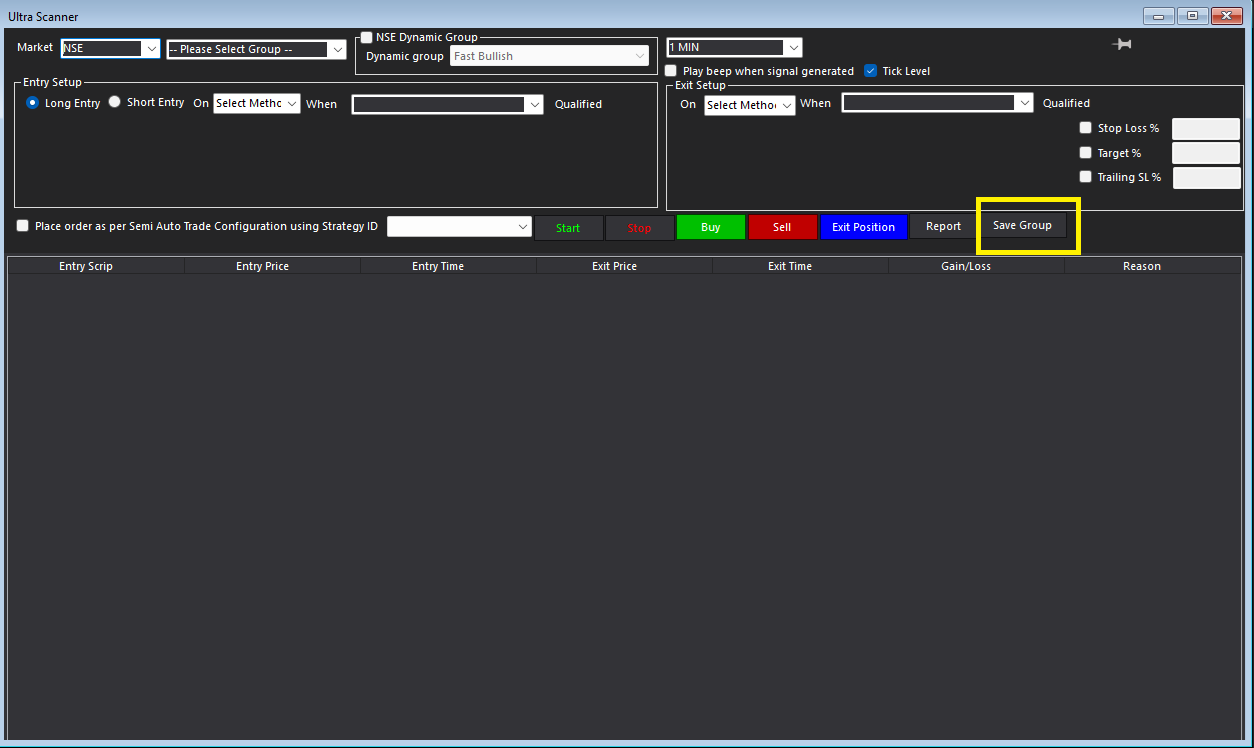
5. "Save To Group" option in Ultra, Option and Straddle Scanner.
08th Aug 2025:
1. Trade From Chart (Applicable for Candlestick chart)
The Open Positions can be viewed directly on the chart with the horizontal line.
To activate and deactivate the feature, go to Settings> Trading Preference and turn the three options to TRUE
a. Trade from Chart
b. Show Order Book
c. Show Position Book

On the chart, the line will highlight (on left side)
a. Long/Short
b. Positional/Intraday
c. Square-off Icon <->
d. Reverse Icon
e. MTM
*Note this feature will be applicable on the new chart after the settings are changed.

In addition to the trade line, the order line will also be presented, featuring an exciting option to modify your order. Simply DRAG the order line to where you want to place the order, and you'll be prompted to confirm before it's placed.
2. D Smart Matrix (Path - Matrix Menu --> D Smart Matrix)

3. DCA Volatility Squeeze Indicator and System builder conditions added for all charts for P&F, Renko, HA, Kagi, LB, Ratio


4. UI Optimization & Standardization – Improved and consistent user interface across the application, including tab sequence alignment.
11th July 2025:
1. Stock SIP order
User can Create SIP for NSE and BSE Stocks or ETFs with the frequency option of Daily, Weekly, Fortnightly or Monthly.
*Please note that the order will be executed at 12:30pm IST during the market hours, which is subject to the availability of funds in the client's account.
Go to Reports > SIP Order Book

2. Trailing Stop Loss-Bullish & Bearish indicator & its SB conditions for OHLC chart
A percentage-based trailing stop-loss system on an OHLC chart automatically adjusts the stop-loss level by a set percentage on closing Bar/Candle below the current price (for long positions) or above the lowest price (for short positions), aiming to lock in profits while allowing for continued participation in a favourable trend.

To add the indicator, go to Indicator > Select Trailing Stop-Loss Bullish/Bearish depending upon the position.


3. Volume Donchian Channel Indicator & SB conditions for OHLC, Renko & P&F chart


4. D-Smart indicator for Renko chart, Buy/Sell Arrow conditions

5. ROC-Abs Indicator for all charts, added Above/ Below Value conditions in the System Builder

6. System Builder Conditions for ATR-based SMA, Adaptive RSI, Bollinger Band, BZ-line, Chikou Span price percent, Donchian Channel, Forword displayed MA, Keltner ATR, MA envelope, Swing Line indicators
7. Stretch Indicator for all charts -
The Stretch indicator, when displayed on a chart, visually represents the deviation of a stock's price from its moving average, helping traders identify overbought or oversold conditions.

8. High Low Momentum Index Indicator for all charts - SB conditions Depend on price type & momentum

9. Guppy Moving average Indicator for all charts

10. Average Trend indicator for all charts -
Average line & SB conditions added

1st July 2025:
1. Bracket Order:
A Bracket Order is a type of order that allows traders to place a main order along with two opposing-side orders - a target/profit order and a stop-loss order simultaneously. This aims to limit potential losses while locking in profits.

2. Auto Slicing.
A Slicing order is a type of large order that is broken down into smaller parts. Auto Slicing will place the order, slice the quantity as allowed per order, and place the orders automatically.

Just make sure the No. of Slices are selected by user.

3. What’s New?
Now check out the new features released in the What’s New? Icon.

4. Renko patterns
A. Anchor Super Bricks - Bullish
The Super Bricks – Bullish is the bullish continuation pattern. The retracement post-rally and resumption of trend is where the affordable risk and a favourable risk-reward setup are placed.
You can add the pattern on chart from Indicators > Pattern

B. Anchor Super Bricks – Bearish
The Super Bricks – Bearish is the bearish continuation pattern. The retracement post-fall and resumption of the trend is where the affordable risk and a favourable risk-reward setup are established.
You can add the pattern on chart from Indicators > Pattern

5. Average line added in Intra VWAP Disparity Index indicator for P&F & Renko charts.
The VWAP Disparity Index is a technical momentum indicator that measures how far the current price of an asset deviates from its Volume Weighted Average Price (VWAP), helping traders identify overbought or oversold conditions and potential reversals.


6. System builder conditions added in Intra VWAP Disparity Index indicator & intra VWAP indicator for all charts.
- Close above Intra Vwap
- Open above Intra Vwap
- Low above Intra Vwap
- High above Intra Vwap
- Close below Intra Vwap
- Open below Intra Vwap
- Low below Intra Vwap
- High below Intra Vwap
- Intra VWAP & Avg crossover

7. Open positions color should be editable in Order Book & Net Position.
Now check out the new features released in the What’s New? Icon.


13th June 2025:
1. Premium Discount Scanner
The "premium" or "discount" between an underlying stock and its futures contract refers to the difference in their prices, which can offer arbitrage opportunities and insights into market sentiment for traders, as futures trading at a premium (contango) often reflects expectations of higher future prices, while a discount (backwardation) can suggest anticipated lower prices or supply gluts.
Premium-Discount Scanner can help you find these opportunities.
Go to Scanner > Smart Scanner > Premium-Discount Scanner

2. New SB conditions of the Efficiency Ratio Indicator (OHLC, P&F, Renko, LB, HA, Kagi)
The Efficiency Ratio (ER) indicator, developed by Perry Kaufman, measures the "efficiency" of price movement by comparing the net price change over a period to the total sum of absolute price changes during that same period, with values closer to 1 indicating a strong, trending market and values closer to 0 suggesting a choppy or non-trending market. Read More

3. New SB conditions of Average Trend Indicator (OHLC, P&F, Renko, HA)
The average trend is derived from the trend strength of the single moving average indicator. A rising moving average is considered a bullish sign and a falling moving average is considered a bearish sign. Therefore, the slope of the moving average is an extremely valuable signal. Based on the slope of the moving average, the average trend indicator calculates the strength of the trend. Read more

4. Bug Fixes
06th June 2025:
A. Scanners
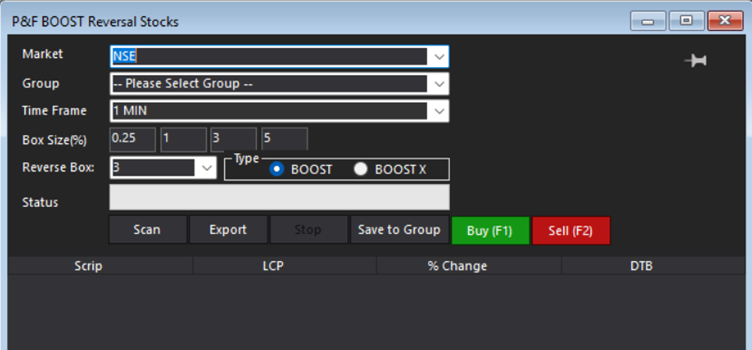
P&F BOOST Reversal Stocks Scanner
Path—> Scanner—> Smart Scanner
The BOOST Reversal Stock Scanner is an effective multi-timeframe technique for identifying two key opportunities:
This scanner is built using Point & Figure (P&F) charts, which are noiseless by design. This charting method allows the strategy to remain objective and visually clear.
Conditions Used for BOOST Scanner:
Conditions Used for BOOST X Scanner:
BOOST X follows similar principles but focuses on multiple support confirmations:
BOOST X identifies stocks that have tested multiple support levels on higher timeframes, increasing the strength of the signal.
B. System Builder condition.
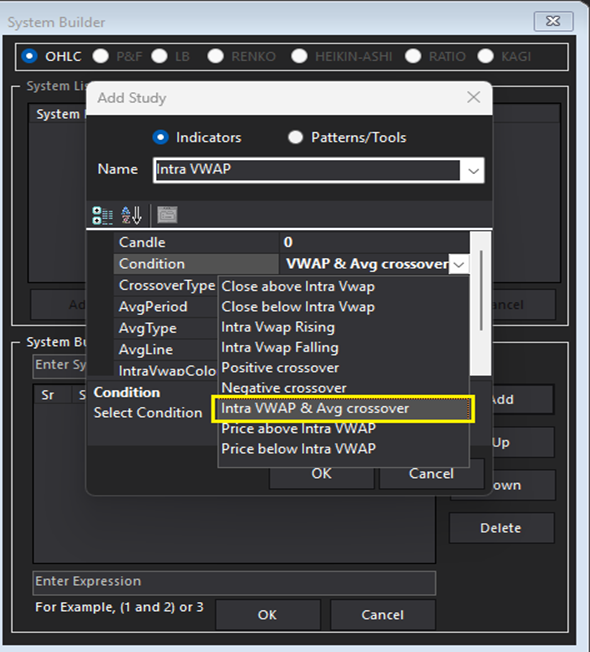
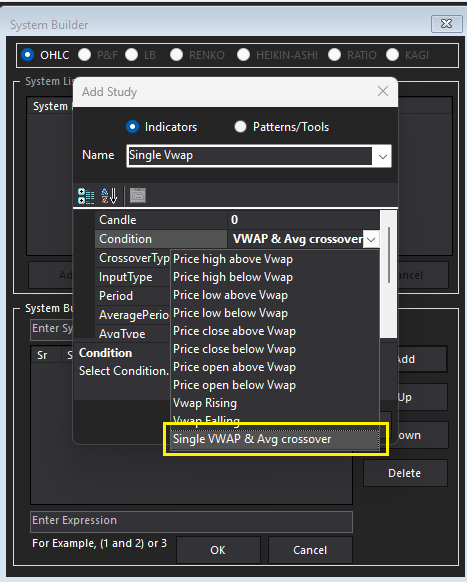
In Intra and Single VWAP indicator average line added for all charts.
Positive and negative crossover conditions for all charts
C. Renko Patterns
a. Renko Support Pattern
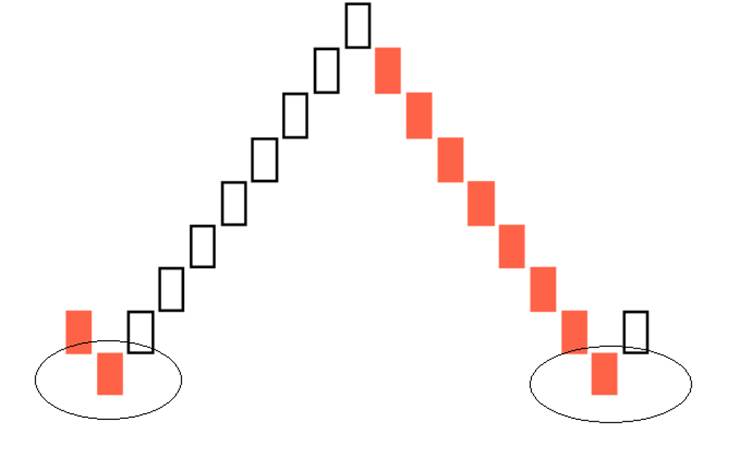
Two red bricks at same level followed by bullish brick (even single).
b. Renko Resistance Pattern
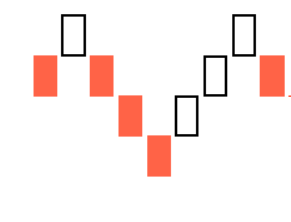
Two bullish bricks are at same level followed by bearish brick (even single).
c. Renko Resistance Pattern
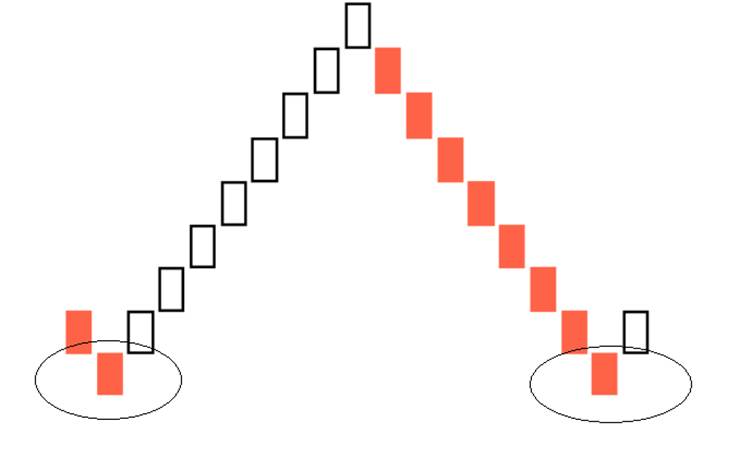
Two red bricks at same level followed by bullish brick (even single).
d. Probable Renko Support Pattern
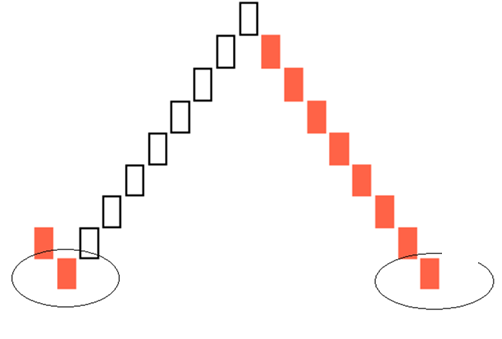
Two red bricks are same level.
e. Probable Renko Resistance Pattern
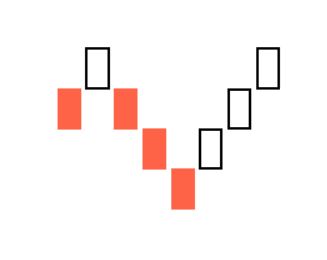
Two bullish bricks are same level.
f. Renko Multi-support Pattern
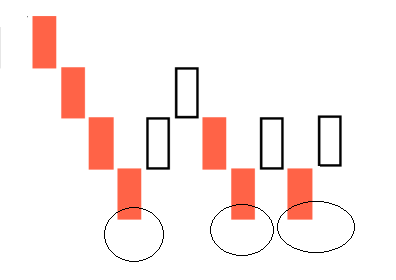
Three red bricks at same level followed by bullish brick (even single).
g. Renko Multi-Resistance Pattern
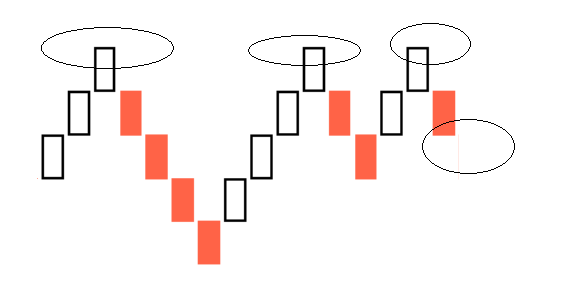
Three bullish bricks are at same level followed by bearish brick (even single).
h. Probable Renko Multi-Support Pattern
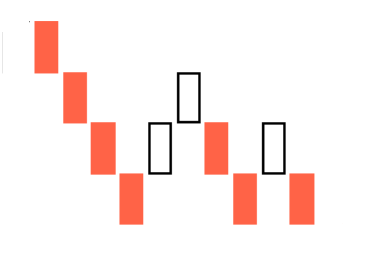
Three red bricks are same level.
i. Probable Renko Multi-Resistance Pattern
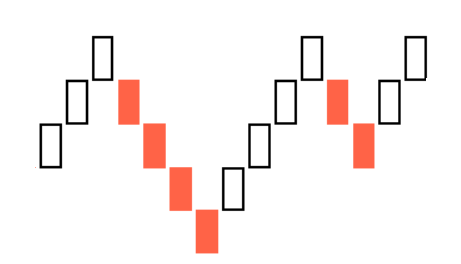
Three bullish bricks are same level.
j. Bullish Swing Failure
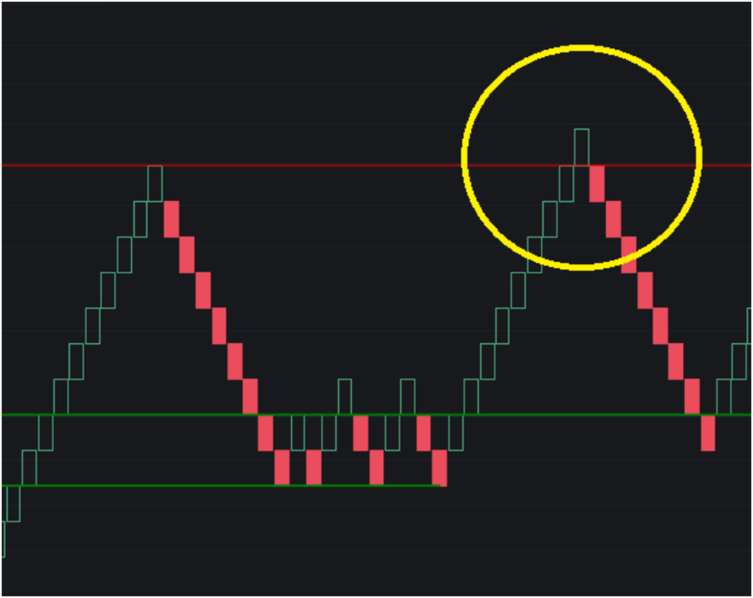
The two bullish bricks are at the same level, followed by the next 1 or 2 bullish bricks above the previous high. The bearish reversal brick confirms the failure of the swing breakout.
k. Bearish Swing Failure
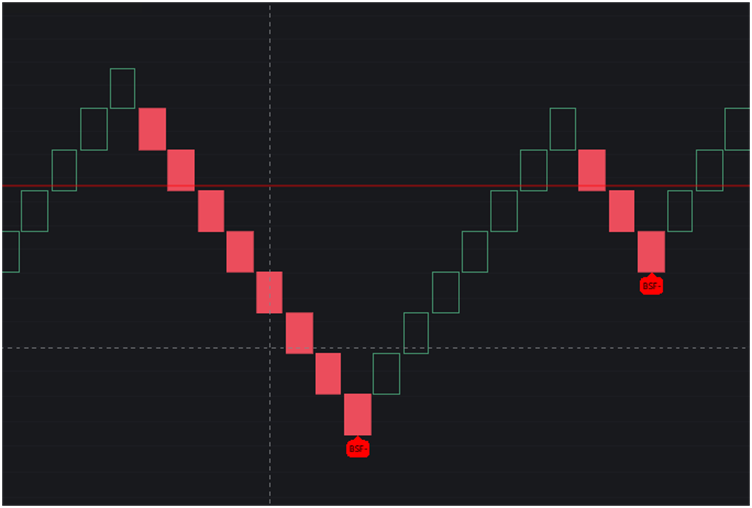
The two bearish bricks are at the same level, followed by the next 1 or 2 bearish bricks below the previous low. The bullish reversal brick confirms the failure of the swing breakdown.
D. Features
Added "Export CSV" functionality in all charts for Master and Standalone both indicators.
16th May 2025:
A. Scanners
1.Intraday Momentum Trading Scanner.
The Intraday Momentum Trading Scanner is designed to help you identify high-momentum stocks throughout the trading session, allowing you to capitalize on short-term price movements. Momentum trading involves focusing on stocks that are demonstrating strong price action, making them ideal candidates for intraday trades.
Path—> Scanner—> Smart Scanner

2.Options Trend Scanner.
With this update, the Option Trend Scanner gains the ability to factor in a denominator while scanning for potential opportunities within your selected group.
Path—> Scanner—> Smart Scanner

B. Iceberg Order
An Iceberg order is a type of large order that is broken down into multiple slices. The second slice orders will be placed only after the previous slice orders are executed. Read more
Path--> In Buy/sell window

C. Features
Added logic to separate "My Groups" (User-Defined Groups) and "Predefined Groups" in dropdown of group selection. In the below menu:
1.EOD scanner.
2.Smart Scanner.
3.Table.
4.Matrix.
5.Indicator Digger
25th April 2025:
A. Indicators & System Builder condition.
1."N boxes" SB conditions in Band Indicators for all charts
Bollinger bands
Donchian channel.
MA On Bollinger Band.
MA On Donchian Channel
2."Super Swing Line" Indicator & SB conditions for all charts.

B. SB condition of Average Trend Indicator for LB,P&F and Renko charts.
C. Patterns
1.XO2 Column Bullish/Bearish for P&F chart.
When the highs of Columns X and O are the same, the Bullish XO 2-Column is formed when the highs of the two columns are the same, and the Bearish XO-2 Column is formed when the lows of the two columns are the same.

2.Anchor Column Follow Through Bullish/Bearish for P&F chart.
Anchor Column Follow Through (AFT) pattern is the continuation pattern with the affordable stoploss. Now you can add from the Pattern, which will be highlighted on the chart.

3.Pre-defined Pattern in OHLC Scanner.
Close < Open Close = Open Close > OpenD. Features
1. “Volume Candle” chart.
Path--> In view menu (For OHLC chart)


28 March 2025:
A. Indicators & System Builder condition.
1. Trend Quality indicator and SB conditions for OHLC chart.
The Trend Quality indicator is designed to quantify the strength or momentum of a trend by measuring the percentage of days that the market closes in a bullish or bearish direction over a specified period. It helps traders understand the strength of the prevailing trend by examining the frequency of upward and downward movements. Read more on the blog.

2. OI Change indicator and SB conditions for OHLC chart.

3. MACD Donchian Channel Indicator and SB conditions for all charts.
The MACD Donchian Channel indicator combines two popular technical analysis tools: the Moving Average Convergence Divergence (MACD) and the Donchian Channel.
By integrating both indicators, the MACD Donchian Channel provides a comprehensive view of price trends and volatility. Traders use this combined tool to spot potential buy or sell signals, as well as to assess trend strength and breakout opportunities, making it useful for both trend-following and range-bound strategies.

4. VSTOP Indicator and SB conditions for all charts.
The Volatility Stop (VSTOP) indicator is a technical analysis tool designed to help traders set dynamic stop-loss levels based on market volatility.
Unlike traditional fixed stop-loss methods, which use a predetermined price level, the Volatility Stop adjusts according to the fluctuations of the asset being traded. This makes it more responsive to changing market conditions, allowing traders to stay in a trade during periods of normal volatility while protecting them from sudden, sharp price movements.
The indicator is typically calculated using measures like the Average True Range (ATR) or other volatility metrics. It is often placed a certain distance from the market price, which expands or contracts as volatility increases or decreases. Traders use the Volatility Stop to manage risk more effectively, ensuring that stop levels adapt to the market's behaviour rather than staying static.
Now you can add this indicator in TradePoint from Indicators. Here is the indicator on the chart.

5. RSI Donchian Channel Indicator and SB conditions for all charts.
Donchian Channel on the price is a well-known indicator, and you can read about it here.
An innovative feature of the Donchian Channel on RSI is the most powerful tool for traders and investors.
You can add this indicator to the chart using these steps.
Indicator > RSI Donchian Channel

How to Trade RSI Donchian Channel?
A rising Donchian Channel and a rising Relative Strength Index (RSI) offer a powerful insight into bullish market momentum. The RSI Donchian Channel, which marks the higher high and higher low over a specified period, illustrates the bullish price range expansion, indicating an ongoing uptrend when its bands slope upwards.
Meanwhile, a rising RSI, typically above the midpoint of 50, signals strengthening momentum as buyers dominate the market.

Refer to the chart above to identify the bullish and bearish setups based on the RSI and Donchian Channel.
6. Bull Bear Session Counter indicator and Sb conditions for OHLC chart.
The Bull-Bear Session Counter by Definedge is a powerful trend-following indicator that helps traders clarify market sentiment. By default, it plots a 15-day bullish and bearish candle line, clearly representing market momentum.
The key feature of this indicator is the crossover between the bullish (green) and bearish (red) lines, acting as a decisive signal for trend direction. When the green line trends higher, it indicates bullish dominance, whereas a rising red line suggests bearish control.
Traders can fine-tune the indicator based on their trading horizon—short-term traders may opt for a 5-15 bar period, medium-term traders can focus on 15-25 bars, and long-term traders are advised to use a 25-50 bar period for a broader perspective.

B. Scanners
1. D Pivot All Clear Scanner
Pivot levels are crucial tools in trading. They help traders identify key support and resistance levels. These levels are calculated based on the previous day's data, providing insight into potential price movement.
When a stock clears these pivot levels, it signifies a shift into a new zone, often indicating a trending market. For short-term traders, this presents an opportunity to capitalise on momentum as the stock enters a new phase. By scanning for stocks that have cleared their pivot levels and are trending, traders can identify potential profit opportunities.
To scan, go to Smart Scanners > D-Pivot All Clear Zone Stocks. {Check This}

2. Probable AFT Scanner
AFT stands for Anchor Column Follow Through Pattern. While there are patterns in the formation, a Probable AFT scanner will help you plot the patterns.
To explore the scanner, Go to the Scanner > Smart Scanners > Probable AFT Scanner.

C. Patterns
For OHLC chart.
1. Bullish/Bearish candles in last N candles. (Sub -conditions in drop down)
{Image of the Condition} – Refer below image

2. Absolute N value conditions. (Sub -conditions in drop down)

3. Close=Open

4. Close Greater Than Open

5. Close Less Than Open

D. Features
1.Straddle/RS/Spread Watch in Market menu.
Path-->Market--> Straddle/RS/Spread Watch


2. Chikou Span values in the Ichimoku indicator digger.
Path-->Scanner--> Indicator Digger--> Ichimoku indicator digger.

28th February 2025:
1. Straddle Watchlist in the Market Menu
Introducing a Revolutionary Feature for first Time in India – the Straddle Watchlist by Definedge! While you may be familiar with traditional market watches or watchlists, TradePoint takes it to the next level with this groundbreaking tool.

With the Straddle Watchlist, you select the strike price, and the straddle is instantly added to your watchlist, giving you seamless access to real-time trading and chart viewing.
Plus, enjoy the flexibility of analysing OHLC, P&F, and Renko charts, all of which can be set as your default with just a double click.

2. Detrend Price Oscillator and the system builder conditions for all charts
The Detrend Price Oscillator (DPO) is a technical analysis tool used to isolate the cyclical components of a price series by removing the long-term trends. It is calculated by subtracting a longer-term moving average from the price, typically a simple moving average (SMA), to help traders focus on the price movements that occur within a shorter time frame.
The oscillator is often used to identify overbought or oversold conditions, momentum shifts, and potential reversals in the market. It can be particularly useful for detecting price cycles or patterns that might not be as apparent when viewing the raw price data.

3. MACD indicator for Ratio and TOI chart.

4. Keltner ATR indicator in Sum/Ratio chart.
5. System builder condition in below Indicators for all charts.
a. Alligator indicator
b. Z -Score indicator.
c. Bollinger Band
d. Bollinger Bands Price Percent
e. Connors RSI indicator
6. Positive & Negative Crossover conditions in all indicators.
7. Added Price Extensions tool for LB & Kagi
8. Change the name of "Negative Retracement" Tool to "Trend Projection" Tool.
9. Added Normal Scale and Log Scale for OHLC chart.
10. Color dialogue box for TOI chart
18th January 2025: Turtle Pattern Scanner
Turtle breakout is one of the most popular trading systems. According to the popular turtle trading system, a price dropping below the 20-day low represents a bearish breakout. It is a commonly used breakout method for trading when a price rises above a specified period.
The column in a P&F chart represents a swing move. A column in a P&F chart may contain multiple sessions.
Turtle Pattern Bullish – Read here
Turtle Pattern Bearish – Read here
Now, you can scan the Turtle Breakout in the intraday timeframe.
Go to Realtime Scanners > Select < Markets > Group > Condition > Frequency

18th January 2025: OIWAP Indicator
Open Interest (OI) Weighted Average Price (WAP) is a technical concept used to gauge market sentiment and price action. It factors the price levels and the open interest associated with those price points.
OI WAP considers the average price at which positions (either long or short) are open in the market, weighted by the open interest at each price level. This metric helps identify key levels where significant market activity occurs, offering insight into potential support and resistance areas. If the price is approaching a level with a high OI WAP, it may indicate strong support (if prices are below) or resistance (if prices are above), as large numbers of open positions could cause increased buying or selling pressure when the price nears these levels. These zones can thus act as psychological barriers for traders, creating price stability or significant breakouts depending on how the market participants react.
Note: Please open the Future Contract chart of the index/stock for the current series and avoid the continuation chart.

18th January 2025: Choppiness Index
The Choppiness Index is a technical indicator designed to measure the market's tendency to either trend strongly or remain in a choppy, range-bound state.
Developed by Australian trader Bill Dreiss, the Choppiness Index assigns a value between 0 and 100, where lower values indicate a trending market and higher values suggest a more indecisive, sideways market. It does not specify the direction of the trend but highlights the degree of price movement uniformity over a given period.
Traders can use the Choppiness Index to decide whether to deploy trend-following strategies or adopt range-bound trading techniques. For instance, a low Choppiness Index may signal the potential continuation of a strong trend, while a high reading could indicate the need for caution or range-trading strategies.
Now, you can add this indicator in the Trade Point.

18th January 2025: D-Smart Price Percent
You can now scan the number of stocks above the D-Smart Price by X-percent defined by user for the various groups in the System Builder.
18th January 2025: Price Extension Tool (P&F, Renko and Heikin Ashi)
The Price Extension tool is a Fibonacci retracement tool for checking the trend. It was available for the OHLC chart, but now you can plot it on the P&F, Renko, and Heikin Ashi charts.

12th December 2024: Price Extensions Tool for OHLC charts
OHLC uses price extensions to show the probable price movement
This is how you can access this feature:
chart—> Tool menu—> Retracement—> Price Retracement
1) Auto Count Tool for OHLC chart.
- Auto Count (Short Term):
Auto count(short term) shows you the short term's probable upside and downside target.
OHLC chart—> Projection menu—> Tool


- Auto Count (Medium Term):
Auto count(short term) shows you the probable upside and downside target for Medium Term.
OHLC chart—> Projection menu—> Tool


- Auto Count (Long Term):
Auto count( short term) shows you the long-term's probable upside and downside target.
OHLC chart—> Projection menu—> Tool


2) Brick Count Tool for Renko chart
Path: Renko chart—> Tool menu—>Brick Count Tool

Click the brick from which you desire to start the count and choose the number of bricks. It will highlight the given user-defined number from the left and right-hand side.


12th December 2024: Indicators for all the system builder conditions
1- Smoothen Dsmart

2- Moving average channel:

3- Double Keltner ATR

12th December 2024: Camarilla Level
Change the colour of each Camarilla Level for all charts
EOD Camarilla Levels
Intra Camarilla Levels
Path: chart—> Tool menu->EDD/Intraday tools-->Camarilla Level
14th November 2024: Sector Volume Analysis
The new Sector Volume scanner lets you analyse volumes across all groups and segments. You can choose to view volume. A higher volume percentage indicates significant activity in that group.
Data can be exported as a CSV file.
Path: Scanners -> Smart Scanners -> Sector Volume.

14th November 2024: Double Donchian Mid Channels Indicator
The Double Donchian Mid Channels Indicator is now available on all charts. It is based on two parameters: the Slow Donchian Channel Period and the Fast Donchian Channel Period.

14th November 2024: Enhanced Trend Detection
In our latest release, we added the Smoothened Super Trend indicator, which integrates an average calculation into the Super Trend indicator and its System Builder conditions across all chart types.

14th November 2024: Chande Kroll Stop Indicator
Introducing the Chande Kroll Stop indicator, a tool for setting stop-loss levels based on market volatility. Developed by Tushar Chande and Stanley Kroll, this indicator uses ATR to determine optimal stop distances for both long and short positions, helping you manage risk effectively.

14th November 2024: New Patterns for Renko Charts
Bearish Brick Equal to N Bricks:
Identifies bearish brick where the bearish brick formation is exactly equal to a specified number (N) of bricks.

Bearish Brick Less Than N Bricks:
Identifies bearish bricks, where the formation consists of fewer than N bricks.

Bearish Brick More Than N Bricks:
Identifies bearish bricks, where the formation consists of fewer than N bricks.

Bullish Brick Equal to N Bricks:
Identifies bullish brick where the formation equals a specified number (N) of bricks.

Bullish Brick Less Than N Bricks:
Identifies bullish bricks, where the formation consists of fewer than N bricks.

Bullish Brick More Than N Bricks:
Identifies bullish brick where formations exceed N bricks.

28th October 2024: New Indicator & System Builder Conditions (For All Charts)
We have added the Volar Conservative Indicator, created to provide you with additional insights into volatility along with its system builder conditions.

28th October 2024: Gap Up Down Scanner
We have added the Gap Up Down Scanner in the Smart Scanner segment. This tool allows you to analyze stock performance following gap up or gap down patterns.
Select your desired market segment and stock group, then choose the gap condition to evaluate. The output will display key metrics, including the number of occurrences, hit ratio, and failure ratio.
For example, when scanning for gap ups, you will see how many times a gap up occurred, the percentage of stocks that closed above the gap, and the percentage that closed below it. This scanner provides valuable insights into stock behavior after gap openings, enhancing your trading strategies.
Path: Scanner -> Smart Scanners -> Gap Up Down Scanner.

28th October 2024: Renko Price & RS Scanner
Introducing the Renko Price & RS Scanner, a powerful tool that enables you to identify outperforming and underperforming scrips using Renko Relative Strength charts. This scanner allows you to run scans based on pre-defined patterns and strategies or create your own, applicable across any market segment and timeframe. You can define parameters such as brick value, chart type, reversal value, and timeframe, while also having the option to run scans on various price patterns or indicators. You can apply existing strategies from the System Builder, select intraday timeframes, and save or export your scan results in CSV format.
Path:Scanner -> Smart Scanners -> Renko Price & RS Scanner.

28th October 2024: Negative Retracement Tool
The introduction of the Negative Retracement Tool equips traders with an advanced mechanism to evaluate further levels in any trending markets.

28th October 2024: Multi-timeframe System Matrix for Heikin-Ashi Chart
Presenting the Multi-timeframe Matrix for Heikin-Ashi Charts. This feature allows you to analyze multiple timeframes simultaneously.

28th October 2024: Additional Features
Intra Action Watch Scanner: With the latest update, your previously selected conditions will remain intact after reopening the Intra Action Watch scanner.

Dynamic Groups: We have added dynamic groups in all real-time scanners.

Modify Indicator on Double Click: You can now modify indicators with a simple double click on the indicator. This feature simplifies your workflow and provides immediate access to adjustments.

Average Line in Delivery Volume: The addition of an average line in the delivery volume chart provides a clearer visualization of trading volume trends. This enhancement aids traders in gauging overall market interest and making more informed decisions based on volume data. 
Market Watch User Preferences: You can now customize the Market Watch, including font and color settings for the Order Book, Trade Book, Positions, and Holdings. This personalization feature allows for a more tailored trading interface that suits your individual preferences. 
% Change in Candlestick Chart Commentary: The commentary section of the candlestick chart now includes the percentage change for all time frames. 
Open Indices Chart on Double Click: You can now access indices charts with a simple double click on the index on the menu bar, making it easier to monitor market trends and overall market performance without navigating through multiple menus.

Index Widget: A new Floating Index Widget has been added to the Market Menu, offering quick access to key indices and their performance metrics even if you minimize TradePoint Desktop.

29th October 2024: New Renko Patterns


24th September 2024: New Smart Scanner
Introducing the Listing Day Breakout Scanner, a powerful tool designed to scan stocks that are trading near their listing day. This scanner enables you to easily identify stocks showing significant action in relation to their listing day price, including both bullish and bearish breakouts. Whether you are looking for stocks that are breaking above or below their listing day levels, this tool provides a streamlined way to spot these opportunities.
Path: Scanner -> Smart Scanner -> Listing Day Breakout Scanner.

24th September 2024: New OHLC Indicator (only for System Builder)
Gained By-Lost By N Percent indicator helps to identify significant price changes and trends. Lost by n% allows you to identify and filter stocks that have decreased in value by a specific percentage (n%) compared to the previous close and Gained by n% identifies stocks that have increased in value by n% compared to the previous close.

24th September 2024: New Sectors Added to Sector Matrix

24th September 2024: New Tool for Point & Figure (P&F) Charts
Introducing Auto Open Vertical Counts for Point & Figure charts. This tool automatically plots open vertical counts for both upward and downward movements. It simplifies the process of identifying potential price targets based on the vertical count. This tool plots vertical counts whose targets are still open.
Path: Task Bar -> Count -> Auto Open Vertical Counts.

24th September 2024: New Indicators (For All Charts)
We have introduced a range of new indicators to enhance your charting experience. Each indicator provides unique insights and analysis, offering you a variety of tools to refine your strategies.
To better understand each indicator and its application, visit the following links:


Introducing the Volar Indicator, this indicator calculates volatility-adjusted returns for the selected period, offering a different perspective on a scrip's performance. By factoring in volatility, this indicator provides a more comprehensive measure of how a scrip has performed relative to its risk profile over time.


24th September 2024: New P&F Patterns


24th September: New Patterns OHLC Charts
Detect potential bearish reversals formed over 5 periods.

Identify bullish reversal opportunities formed over 5 periods.

Identify shorter-term bearish reversals formed over 3 periods.

Spot shorter-term bullish reversals formed over 3 periods.

26th August 2024: Date Breakout Scanner
In our latest update we have added Date Breakout Scanner. This scanner helps you to identify scrips that today have crossed the high, low or close of the selected date.
You can customise your search by selecting “ High, Low or Close" to focus on specific breakout criteria.
Path: Scanner -> Smart Scanner -> Date Breakout Scanner.

26th August 2024: New Options Added
We have introduced a new option in the Renko EOD scanner. This update includes two scanning options: "Fresh" and "At Last Brick." The "Fresh" option displays results that have already qualified, allowing you to see scrips that met the criteria. Meanwhile, the "At Last Brick" option shows results including scrips that meet the criteria at the current brick.
Path: Scanner -> EOD Scanner -> Renko Scanner / Renko RS Scanner.

16th August 2024: Real-Time Indicator Values in Market Watch
Introducing a new feature in Market Watch that allows you to view real-time indicator values alongside stock prices. You can now add multiple indicators of any charting type directly to your watchlist, enabling a more comprehensive and immediate analysis of market conditions.

16th August 2024: New Renko Patterns Added to Charts and Scanners
Expand your trading strategies with the following newly introduced Renko patterns:


8th July 2024: Intraday Timeframe Now Available
Introducing the addition of Intraday timeframe to all Smart Scanners and Matrix Tables.

8th July 2024: Added Price Delivery Volume Matrix
Introducing the Price Delivery Volume Matrix in the Volume Scanner section! Price Delivery Volume Matrix is a unique way of looking at the volume. You can select the number of bars and run the scanner on a group of stocks of your choice.
The bars are scored based on the price and volume action. If the price is bullish with higher delivery volume the score is positive and if it is bearish with higher delivery volume, then the score is negative.

8th July 2024: Cloud Extension
Our latest update includes the addition of the Cloud Extension feature in the Ichimoku indicator. This update extends the projection of the Ichimoku Cloud further into the future, providing you with a more comprehensive view of potential support and resistance levels. The Cloud Extension helps in anticipating future price movements and trends.

8th July 2024: Average Volume Breadth Now Available
WWe have updated the breadth chart with the inclusion of Average Volume Breadth. This shows the average volume breadth chart of the selected index and will help you in analysing the trend in average volume.

8th July 2024: New P&F Chart Patterns


6th June 2024: Candle Lock Feature
In our latest update we have added the Candle Lock feature. This ensures that candle on your chart is not shown until formed, no longer fluctuating with live price movements. Each candle will now only appear once the selected period is complete.
This feature helps you with preventing early entries and exits.

6th June 2024: New Columns in Net Position Tab
Now, alongside existing metrics, you can view "Today's P&L" and "Today's % Change" directly. This addition allows you to monitor the profit or loss and percentage change of each position for the current trading session effortlessly.

6th June 2024: Delivery Volume Scanner
In our latest update we have added the Delivery Volume Scanner, exclusively applicable to the NSE market. This new scanner allows you to select a group of stocks and perform a scan to gain insights into trading activity. The scanner displays both the total volume and the percentage of that volume that was 'Delivery' during the trading session for all stocks in the selected group. You can easily sort stocks by the highest delivery percentage, helping to identify stocks with strong bullish trends. Conversely, stocks with a low delivery percentage indicate higher speculative activity.
Path: Scanner -> Smart Scanners -> Delivery Volume Scanner

6th June 2024: New P&F Chart Patterns

Bearish


6th June 2024: New OHLC Indicator
This new addition helps you to accurately identify and visualise ranges. This indicator provides clear markers indicating support and resistance levels. Using the selected period volatility data this indicator plots a range which acts as support and resistance levels. Furthermore, conditions for the Range Marker indicator are now available in the System Builder, enabling you to create custom strategies.

6th June 2024: Adaptive TSI
Adaptive TSI (True Strength Index) enhances the traditional TSI by adjusting smoothing parameters based on market volatility. It provides timely buy and sell signals through crossovers with its signal line and zero line, suitable for various charting methods and market segments. This adaptability improves accuracy in trend identification and signal generation.

6th June 2024: Unique Bearish and Bullish Patterns
Point & Figure charts now include 'Rare Occurrences - Bullish' and 'Rare Occurrences - Bearish' patterns. Patterns that do not occur often are included in this category. Double Broadening, Multicolumn Triangles and Quadruple breakout are rare occurrence patterns. With this feature, you can scan for stocks that qualify for these rare patterns with a single click.


6th June 2024: New OHLC Pattern
Introducing the Pocket Pivot Pattern for OHLC charts. This new feature equips users with a powerful tool to identify potential buying opportunities within the market. This pattern has been incorporated into OHLC charts as a bullish signal. You have the flexibility to adjust the period, typically set at 10, to suit your analysis. The pattern detects bullish candles within the chosen period, indicating the candle has absorbed all the downward momentum from the preceding selected period.
Bullish
Bearish

6th June 2024: Breadth Charts Updated
Average line has been added across all Breadth charts, providing a clear visual reference for trend analysis and comparison.
To add average line, right click on the chart and select "Add Avg Line".

6th June 2024: Delivery Volume Quantity
This feature provides valuable insights by displaying the quantity of delivered shares. This enhances your ability to analyse market activity based on delivery volumes.

17th May 2024: PayOffs Now on Charts
Now plot your PayOff Strategies on Futures charts. Directly use the strategies you have created on Opstra and plot them on Futures charts. You can easily see your profit, loss and breakeven zones. This feature, located in the Tools section, provides a comprehensive view of the performance of your trading strategy.

13th May 2024: Delivery Volume
The Delivery Volume tool provides you with important insights into volume, helping in the identification of bullish or bearish trends. Delivery Volume represents the volume of stock that is physically delivered to buyers from the total traded volume. It signifies the percentage of volume that results in the transfer of shares between accounts, offering a direct measure of investor conviction and participation in that scrip. With this tool, you can easily compare delivery volume as a percentage of traded volume,
allowing you to better understand the trend with quantity
Path:- Tools -> Delivery Volume

26th April 2024: Place Orders Directly from Option Chain
You can now seamlessly execute buy and sell orders of individual leg directly from the Option Chain. This addition provides greater convenience in options trading.

26th April 2024: Max Trades in Auto Trade Engine
The Max Trades feature has been added to the Auto Trade Engine, allowing users to specify the maximum number of trades to execute. This feature provides greater control over trade execution and helps manage risk effectively.

26th April 2024: Addition of OHLC Spread Indicator (with System Builder conditions)
The OHLC Spread Indicator focuses on plotting the difference between the selected two (Open, High, Low and Close) aspects of the price chart.
The Spread indicator is complemented by System Builder conditions, enhancing your scanning and backtesting capabilities.

26th April 2024: New OHLC Patterns


26th April 2024: Addition of New P&F Chart Patterns


26th April 2024: New System Builder Conditions (OHLC chart)

26th April 2024: New System Builder Conditions (P&F chart)

12th April 2024: OI Profile
The OI Profile feature allows you to select the expiry, strike, strike difference, and the number of lines. A bar graph is then plotted on the right side of the terminal, helping you with the critical support and resistance levels using Open Interest data.

12th April 2024: TOI RS Charts (Line, P&F and Renko)
TOI RS chart, is a powerful tool for assessing the performance of financial instruments. TOI RS charts focus on comparing the relative strength of two instruments. This comparison is achieved by dividing the TOI value of one instrument by that of another, resulting in a ratio that reflects their performance. Analysing the RS chart allows traders to gauge which instrument is outperforming the other. A rising TOI RS chart indicates that the numerator is outperforming the denominator, while a falling TOI RS chart suggests the opposite. TOI RS charts can be plotted using Line, P&F and Renko methodology. Traders can identify strength and weakness in instruments, use it for pair trading and conduct intra-market analysis using TOI RS charts.

12th April 2024: TOI Comparison Line Chart
The TOI Comparison line chart enables you to plot Total Open Interest (TOI) data for two tickers simultaneously on a single chart. This functionality facilitates comparative analysis and provides a view of the relative strength between the selected tickers. Users can select their preferred tickers, specify the respective expiry, and strikes to generate TOI data for both tickers.

12th April 2024: New P&F Chart Patterns


12th April 2024: New OHLC Chart Patterns


12th April 2024: Introducing 3C Pullback Patterns for OHLC and P&F Charts


22nd March 2024: Option Chain Enhancements
Added "Intrinsic and Extrinsic Percentage" column in the Option Chain. Now you can easily track the intrinsic and extrinsic values of options directly from the Option Chain interface. There are two components of the premium of an option: intrinsic value and extrinsic value. Intrinsic value reflects the actual value of strike price versus market price. Extrinsic value of an option is time value, implied volatility, etc.

22nd March 2024: Positive and Negative Bias Candles
In this release, we have added two new candlestick patterns, namely the Positive Bias Candle and Negative Bias Candle. The Pattern Positive Bias Candle signifies a strong bullish bias when a candle closes in the highest quintile of its range, providing traders with signals for potential upward price movements and favorable conditions for long positions. Conversely, the Negative Bias Candle pattern indicates a significant bearish bias when a candle closes in the lowest quintile of its range, offering insights into potential downward price movements and favorable conditions for short positions.


22nd March 2024: Enhanced P&F and RS Smart Scanner
We have enhanced the “P&F and RS Scanner” with the addition of "Running" and "Fresh" options. These options provide you with more flexibility in scanning.

22nd March 2024: New P&F Patterns


11th March 2024: Cumulative RSI (for all charts)
The Cumulative RSI Indicator helps assessing momentum and trend over short and medium-term periods. It combines the 14-period and 5-period RSI indicators to offer a comprehensive analysis of price movements. The indicator consists of two lines: the green line represents the cumulative RSI indicator, reflecting the strength of price momentum, while the red line represents the average RSI value, providing a reference point for comparison. To know more, click here.

11th March 2024: RSI Delta Indicator
This new indicator offers enhanced insights into market trends and can greatly assist traders and investors. The RSI Delta Indicator measures the change in relative strength index (RSI) values over a specified period. By calculating the difference between current and previous RSI values, the indicator helps identify potential trend reversals, divergences and overbought / oversold conditions in various financial instruments.

11th March 2024: Bollinger Bands on RSI (for all charts)
With this release, we have seamlessly integrated Bollinger Bands onto the RSI indicator. This combination offers a unique perspective on market trends, oscillations and potential reversals. By overlaying Bollinger Bands on the RSI, users gain a new dimension of analysis, allowing for more accurate identification of overbought and oversold conditions.

11th March 2024: Smart Don Indicator (for all charts)
Introducing the Smart Don Indicator, a powerful integration of D-Smart and Donchian indicator, now available for all charts. This indicator provides a comprehensive view of market trends and potential breakouts.

11th March 2024: System Builder conditions for New Indicators
Our System Builder tool has also been upgraded to accommodate the new indicators. You can now create advanced trading strategies by incorporating these indicators along with other indicators, patterns and conditions.


22nd December 2023: Dynamic Groups in Ultra Scanner
Introducing a powerful enhancement to the Ultra Scanner in this release. Now, you can leverage Dynamic Groups to finely filter and customise your scans. One of the key advantages of Dynamic Groups is the real-time updates. These groups will be refreshed every 5 minutes, ensuring users have access to the most up-to-date market data.
The new options include:We are committed to ongoing improvements, and users can anticipate additional dynamic group options in future updates.

10th November 2023: XO Zone Indicator
Introducing the XO Zone Indicator, a Point & Figure chart indicator created by Prashant Shah. This indicator offers a simplified yet powerful way to assess bullish and bearish momentum in your trading strategies. It is designed to be easy to understand and seamlessly integrates into your existing technical analysis tools.
Momentum Analysis: The XO Zone Indicator provides a straightforward measure of bullish and bearish momentum without relying on complex statistical calculations. It is based on the count of bullish ("X") and bearish ("O") prints in the price pattern.
Price-Based: This indicator is entirely price-based and is plotted directly on your chart, making it easy to interpret.
Zone Visualization: The indicator visually represents the balance between bullish and bearish prints. The green zone indicates a bullish trend, where bullish prints outnumber bearish prints. Conversely, the red zone signals a bearish trend, with more bearish prints than bullish ones.
Price Turning Points: In the commentary box, you'll find information about the price levels at which the bullish zone might transition to a bearish zone or vice versa.

10th November 2023: Brick Zone
Introducing the Brick Zone Indicator, a Renko chart indicator created by Prashant Shah. This indicator simplifies the assessment of bullish and bearish momentum in Renko charts.
Momentum Analysis: The Brick Zone Indicator provides a clear measure of bullish and bearish momentum without relying on complex statistical calculations. It focuses on the count of bullish and bearish bricks in the price pattern.
Price-Based: This indicator is entirely price-based and is plotted directly on your chart, making it easy to interpret.
Zone Visualization: The indicator visually represents the balance between bullish and bearish bricks. The black zone indicates a bullish trend, where bullish bricks outnumber bearish ones. Conversely, the red zone signals a bearish trend, with more bearish bricks than bullish ones.
Commentary: In the commentary box, you'll find information about the price levels at which the bullish zone may transition to a bearish zone or vice versa.

10th November 2023: Basket Order
In response to user feedback and to streamline your trading experience, we have introduced the highly anticipated Basket Order feature. It allows you to manage multiple orders with ease, offering greater control and flexibility in your trading strategies.

7th October 2023: Auto Trade Engine Updated
With our latest update, you can now choose between "Positional" and "Intraday" while setting up your strategy.

19th August 2023: New Feature Addition in Options ATM Scanner and Multi-Scrip Straddle Scanner
Options ATM Scanner and Multi-Scrip Straddle Scanner now come with a recalibration feature for options strikes during scanning. This means that as market conditions change, the scanner will automatically adjust the options strikes it considers.

19th August 2023: Introducing New Ready-Made Dynamic Groups
Introducing three new ready made dynamic groups tailored to various trading strategies. These groups are generated using our innovative Matrix table. Stay tuned as we expand the universe in this category, adding more groups.
(Note: -These groups are updated daily, keeping you in sync with the latest market trends.)
Stocks that show potential for bullish intraday moves.
Stocks that exhibit bearish intraday characteristics.
Stocks with short-term bullish prospects.

27th July 2023: Addition of a New Condition in P&F Fusion Matrix
We've introduced "At" condition to the P&F Fusion Matrix.

27th July 2023: Introducing 3 New Indicators

27th July 2023: Commentary for P&F Charts Updated
The Average True Range percentage (ATR%) value is now visible on in the commentary for Point & Figure charts.

27th July 2023: Addition of 3 New System Builder Conditions

14th July 2023: Now Select Preferred Templates
We have added a new feature that allows you to save templates and easily apply them to all your charts. To apply your preferred template just right click on the chart and select "Apply Template". Now select and apply the template you want to plot.

14th July 2023: Put/Call Selection in Options ATM Scanner
With our latest update, Options ATM Scanner will provide even more control and customisation. You can now choose between Put, Call, or both options before running the scan. This enhancement gives you the flexibility to focus on specific types of options contracts based on your trading strategies and market analysis.

11th July 2023: Introducing 2 New Indicators

11th July 2023: An Addition to System Builder Conditions
Force Index Indicator has been added to System Builder conditions. The Force Index indicator is a technical analysis tool that helps identify the strength and momentum behind price movements. Now, you can now create trading systems using this indicator.

11th July 2023: New Feature Addition in Multi-Scrip Straddle Scanner
With this release, we have added the option to Re-Calculate ATM price for the next entry.

11th July 2023: Strike Width
Now you can select the strike width in Multi-Scrip Straddle Scanner and Option ATM scanner.

11th July 2023: Improved Navigation: Option Chain
Option Chain has been relocated to the “Market” tab.

11th July 2023: Indicator/Pattern Preference Updated
In this update we aim to provide you with a more tailored and efficient user experience.

23rd June 2023: Introducing 2 new Indicators

23rd June 2023: Addition of 3 new System Builder conditions

23rd June 2023: Option ATM scanner gets a new feature
Now you can select monthly, first weekly, second weekly and third weekly expiry before running the Option ATM Scanner.

23rd June 2023: Buy-Sell Window Updated

16th June 2023: Introducing 2 new Indicators
16th June 2023: Addition of 3 new System Builder conditions
10th June 2023: ATR and OBV Indicators are updated
Now you can add 2 AverageLines in ATR and OBV indicator.

10th June 2023: A New Indicator for Ratio Charts
Introducing the Smoothed RSI for ratio charts.

10th June 2023: Addition of 4 new Indicators

10th June 2023: Addition of 4 new OHLC System Builder conditions

10th June 2023: Introducing P&F and Renko Chart Options for Multi-Leg Chart
Now you can plot Multi-Leg Chart on P&F and Renko.

10th June 2023: Definedge System in EOD Scanner
Now you can use Definedge System in EOD scanner.

6th June 2023: Options ATM Scanner now includes a powerful new feature
With this release, we have added the option to Re-Calculate ATM price for the next entry.

6th June 2023: Auto Trade Engine Shifted
Auto Trade Engine has been shifted from Settings to the Scanner section.

27th May 2023: Addition of the highly anticipated Auto Square Off feature for algo orders.
With this latest update, users now have the ability to automatically square off their algo orders, enhancing the efficiency and convenience of their trading experience.

27th May 2023: Market Watch in a Fresh New Look.
This release brings a new guise to Market Watch.

27th May 2023: Introducing Donchain Channel for last n bar/column.
In this update we have added Donchian Channel for last n bar/column in System Builder conditions for all charts.

27th May 2023: ATR Indicator in System Builder.
With our latest update, ATR indicator is available in System Builder for Line Break chart.

27th May 2023: Addition of Candle Shadow % in System Builder conditions.
With our latest release we have added Candle Shadow % in System Builder conditions for OHLC and Heikin-Ashi charts.

27th May 2023: Addition of a new P&F pattern.
Now you can plot Bear Trap Follow Through - Bullish pattern on P&F charts.

22nd May 2023: Reduced the number of clicks required for PCR and Snakes Chart
With this new update, we have eased the plotting of PCR and Snakes charts by reducing the number of clicks required. You only need to select Expiry, Base Strike Price, Strike Difference and No. Of Strikes.

22nd May 2023: We have added 2 new indicators.

22nd May 2023: Introducing Auto Trade Feature in Options ATM scanner.
Once the entry pattern is qualified for ATM Option symbols, your trade will be executed automatically.

22nd May 2023: New System Builder conditions.
We have added two new conditions in System Builder.

22nd May 2023: Multi-leg Chart UI change.
Plotting Mutli-leg chart is now simpler.

22nd May 2023: Addition of Disparity Index in System Builder For Ratio Charts.
Now Disparity Index is also available in system builder for Ratio charts.

22nd May 2023: Default Intraday Lines in PCR and Snakes charts.
Intraday lines are now shown by default in PCR and Snakes charts.

16th May 2023: Introducing Bearish and Bullish 5 Ka Punch
With our latest update, we have added Bullish and Bearish 5 Ka Punch which can be plotted separately on Renko chart.
Path;
Open Renko chart > Add Study > Pattern/Tools > Select “5 ka Punch-Bullish or 5 ka Punch-Bearish"

1st May 2023: Introducing FAST Stock Scanner in SMART Scanners
This scanner list downs stocks within group having minimum +5.5% or -5.5% price change. Hence, this tool allow users to list down stocks which are currently volatile in nature because of their price action.

28th April 2023: Introducing New OHLC Patterns in TradePoint Desktop
We have added 4 new OHLC patterns in our system. They are -

28th April 2023: Indicator Preference and Scanner Condition Available for EOD and Realtime Scanner
Now we will providing a radio button to select either from -
Indicator preference: To scan result as per indicator/patterns preference
Scanner condition: To scan result as per system builder condition

21st April 2023: Introducing New P&F Patterns in TradePoint Desktop
We have added 8 new P&F patterns to our system. They are -

21st April 2023: Introducing New Renko Pattern in TradePoint Desktop
‘5 ka Punch - Bullish/Bearish’ is now available on TradePoint Desktop. Please find the below image for reference.
Open Renko chart > Add Study > Select ‘5 ka Punch - Bullish/Bearish’ as your pattern

21st April 2023: Column Hide and Font Change Option
Now users can hide columns and can also change the font of results after running any Scanners, Matrix, and Tables. Now priorities your columns at your convenience.

21st April 2023: Filtration and Sorting of Order Book Columns
We have provided multiple filters and sorting options for Orderbook. Now users can toggle their list at their convenience.

18th March 2023: Now place orders directly from the Option Chain
Select the ‘At the money’ strike price and place the order directly from the Option chain itself. Now users don’t have to open Straddle/Strangle charts separately. Use shortcut key ‘F1’ to open the Buy window and ‘F2’ to open the Sell window.

21st April 2023: Option to Build System Builder While Using Scanners
Now create systems/conditions while using scanners. Users also have the option to select pre-defined and earlier user-defined conditions.

18th March 2023: Tick Data Available for All Charts and Scanner
Press the shortcut key ‘K’ to view Tick data. This feature is available for all charts. To access this feature use this path: Open any chart > Click on View > Select ‘Tick Data’

18th March 2023: Ultra Scanner: No longer just a Semi-Algo Scanner
A few months back we introduced our Semi-Algo scanner known as Ultra Scanner.
This scanner list down Buy and Sell orders as per set criteria, and with just one click users can place auto orders for their convenience.

18th March 2023: Click on scrip name to reset chart
In just one click a dialog box will pop up to change Scrip and Market type. Check the below media for reference.

24th Feb 2023: Introducing New Patterns along with System Builder condition
"High Above for Prev Nth Candle" pattern for OHLC & Heikin chart
"Low Below for Prev Nth Candle" pattern for OHLC & Heikin chart
"Highest O in Last N Column" pattern for P&F chart
"Lowest X in Last n Column" pattern for P&F chart
"X-Count Highest in N column" pattern for P&F chart
"X-Count Lowest in N column" pattern for P&F chart
"X-Count Equal in N column" pattern for P&F chart
"O-Count Highest in N column" pattern for P&F chart
"O-Count Lowest in N column" pattern for P&F chart
"O-Count Equal in N column" pattern for P&F chart

24th Feb 2023: Now place One Cancels Other Order (OCO) on TradePoint Desktop
This feature helps you manage your trades and minimize your risk. With OCO, you can place two orders simultaneously - a stop-loss order and a profit-taking order - and if one order is executed, the other order will be automatically cancelled. This feature is particularly useful for traders who want to take advantage of volatile markets and need to manage their risk more effectively.

24th Feb 2023: Introducing Cover Orders on TradePoint Desktop
We are excited to introduce our latest feature - Cover Orders. This tool is designed to help you limit your potential losses and protect your profits when trading in volatile markets. With Cover Order, you can set a stop-loss order along with a limit order to buy or sell a security. This means that if the price of the security reaches your stop-loss level, your order will be automatically executed at your limit price, helping you to minimize your losses.

21st Jan 2023: Straddle Buy & Sell Menu
A detailed walkthrough while executing Straddle menu. Now users can opt for two symbols in one go to Buy or Sell.
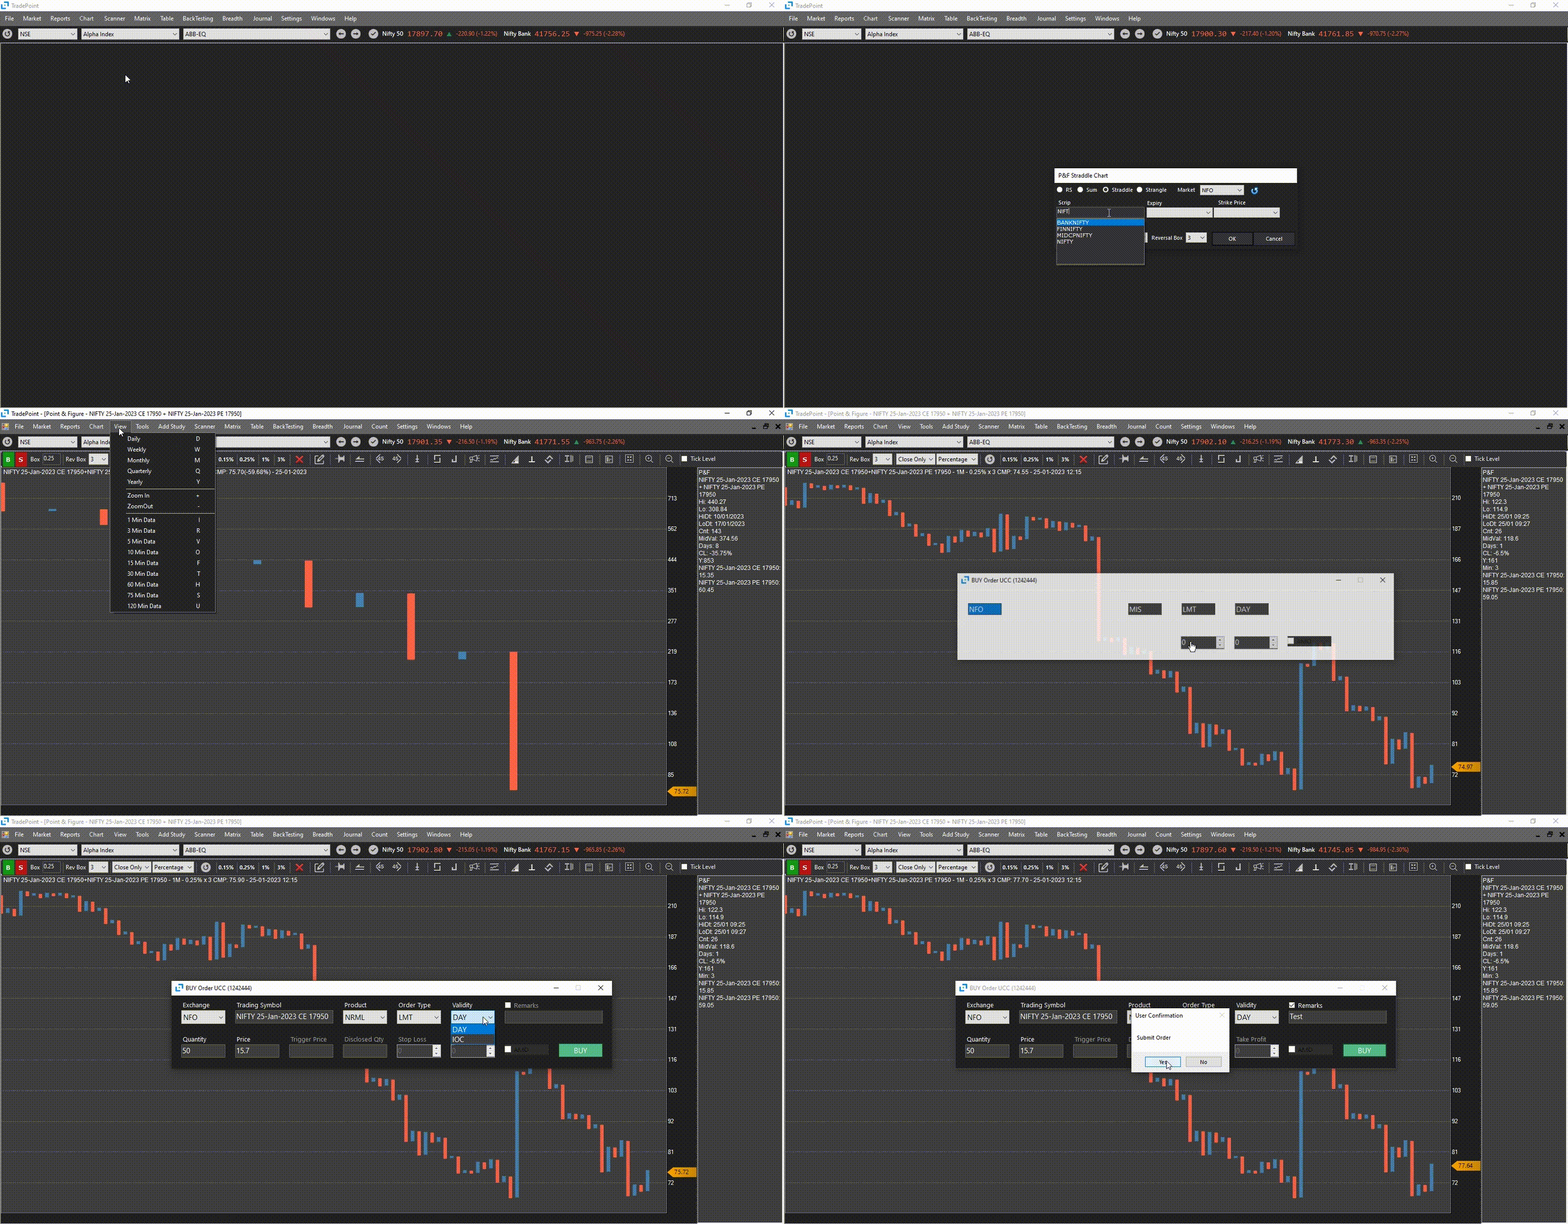
28th Dec 2022: P&F and RS Scanner - New addition in Smart Scanner
This scanner helps you scan the stocks that meet your criteria in the P&F price chart and the Relative strength chart.
Path: Scanner > Smart Scanner > P&F and RS Scanner
27th Aug 2022: Ultra Scanner - One of it's kind Semi-Algo Scanner
We have added an interesting feature in the TradePoint desktop trading terminal. We are calling it Ultra trading scanner, it is our first step towards building Algo trading systems.
Path: Scanner -> Real time scanner -> Ultra Scanner