Customer Support : 020-61923200, [email protected] | Call and Trade : 020-61923220
New Feature Releases in Zone Mobile
27th Feb 2026
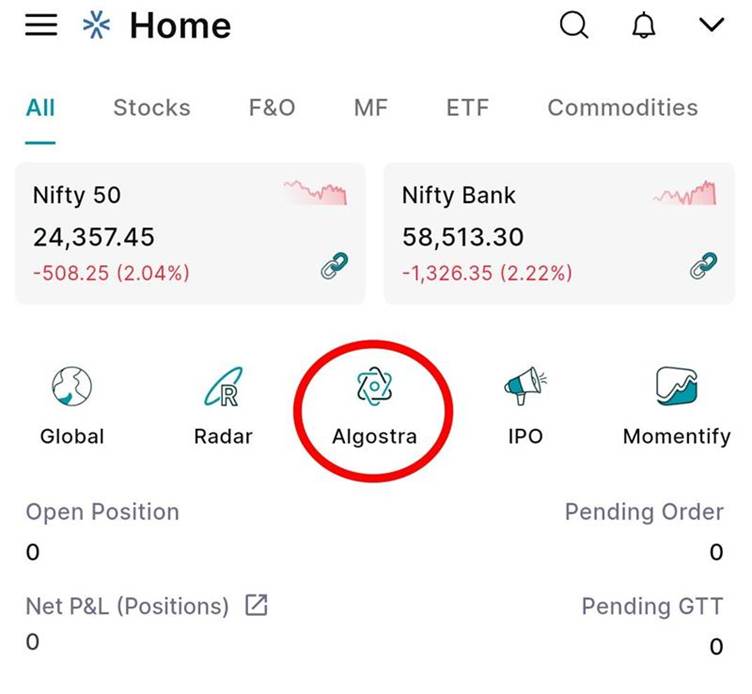
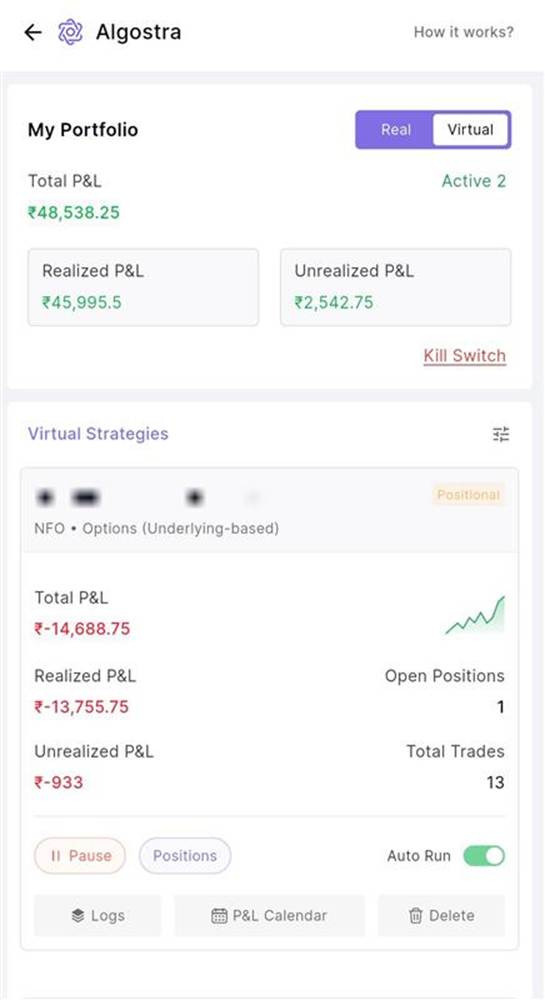
1. Algostra is now live in the mobile app
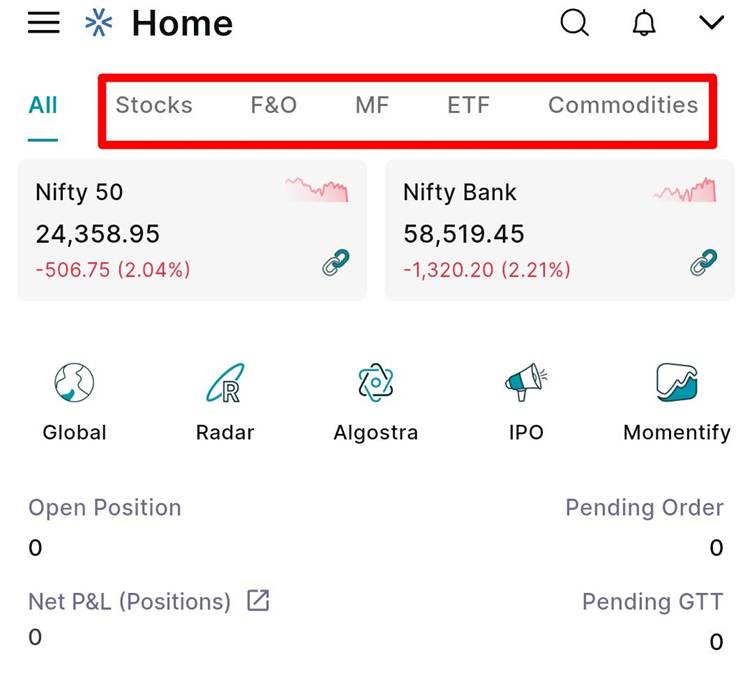
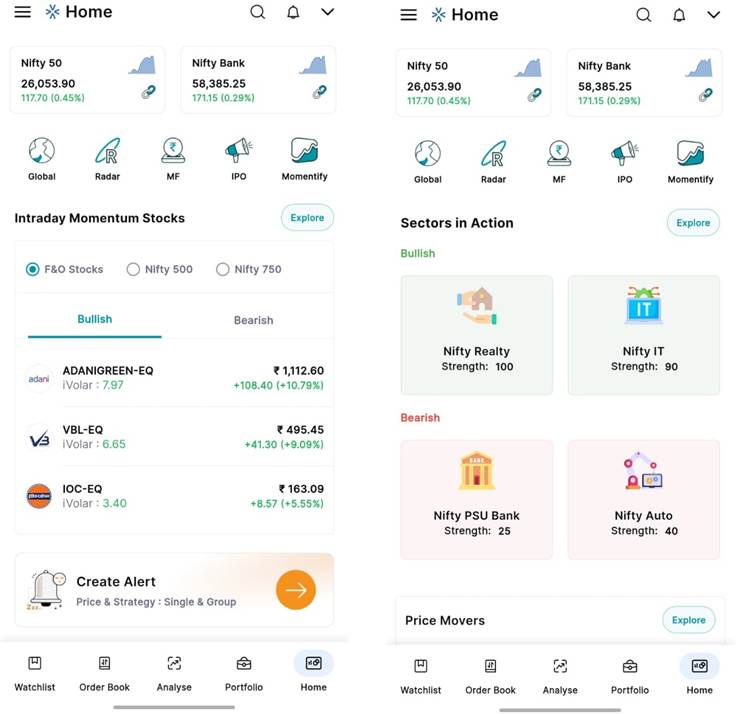
2. New and easy UI for the Zone home page with multiple tabs like Stocks, Mutual Funds, F&O, ETF and Commodities


3. Relative Strength Charts (RS Charts)

4. Straddle and Strangle watchlist

5. Chart Scroller from Watchlist

21st Nov 2025
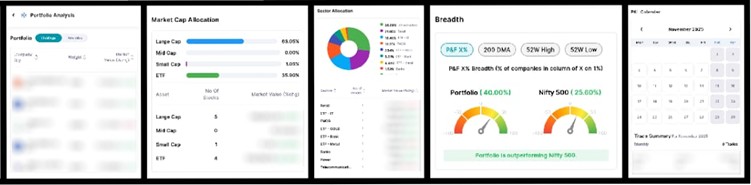
1. Portfolio Analysis feature added
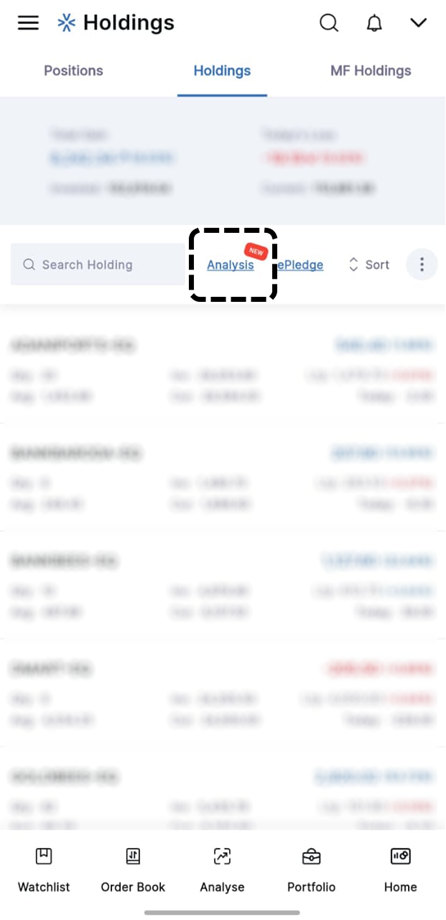
Here is the list of Analysis:
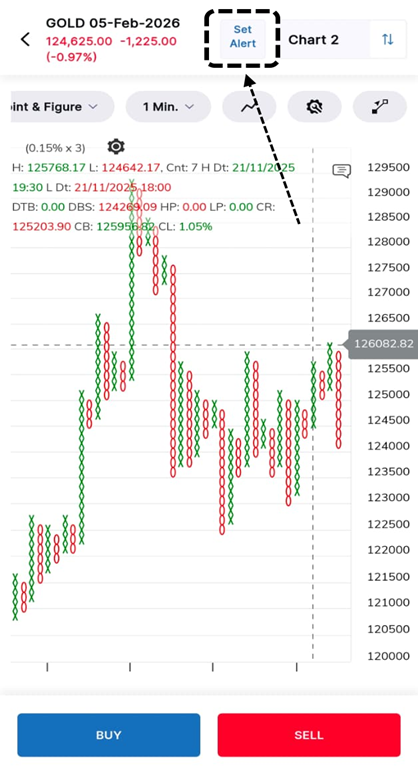
2. Set alerts directly from charts
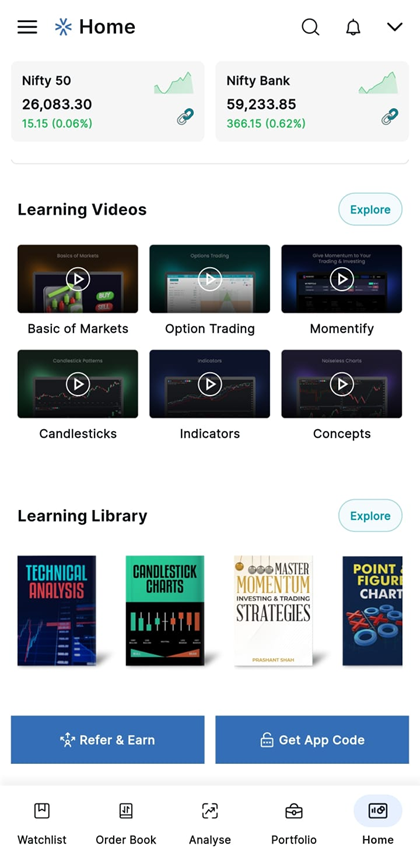
3. New Video Library for learning
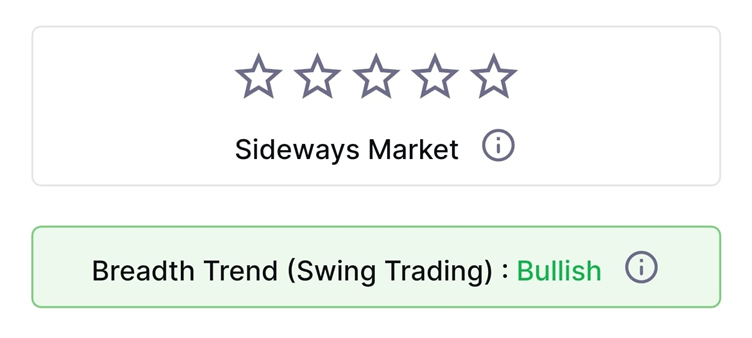
4. Swing trend indication (Bullish/Bearish/Extreme zones) added to home page
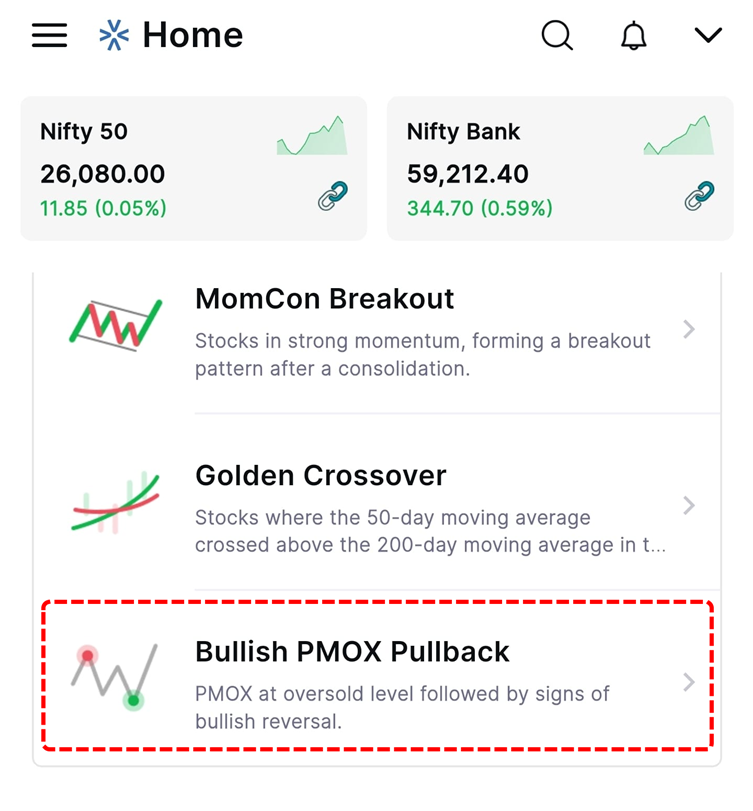
5. PMOX scanners added
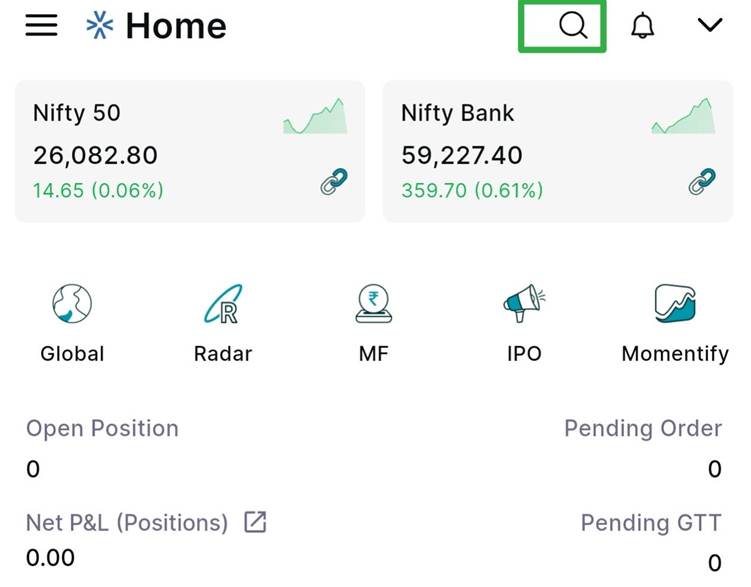
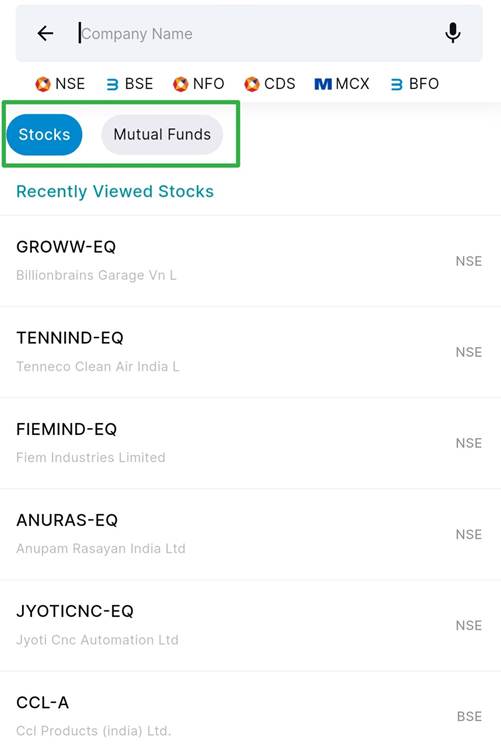
6. Mutual funds included in Global Search
06th Nov 2025
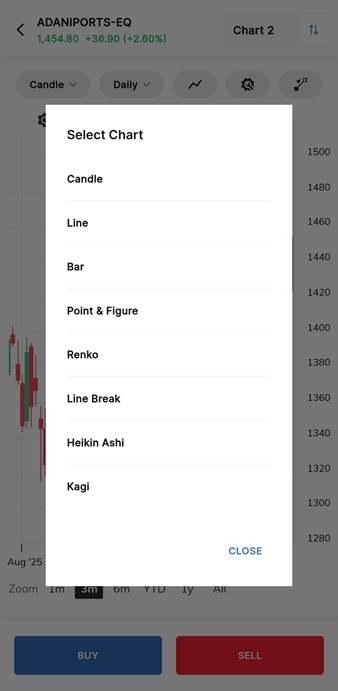
1. Advanced Charting Tools: Features multiple chart types like Candlestick, Line, Bar, Point & Figure (P&F), Renko, Line Break, Heikin Ashi and Kagi for detailed analysis.
2. Option Chain Analysis: Provides deep insights into the options market for better decision-making.
3. Fundamental & Technical Reports: Integrated research tools to evaluate company performance and market trends.
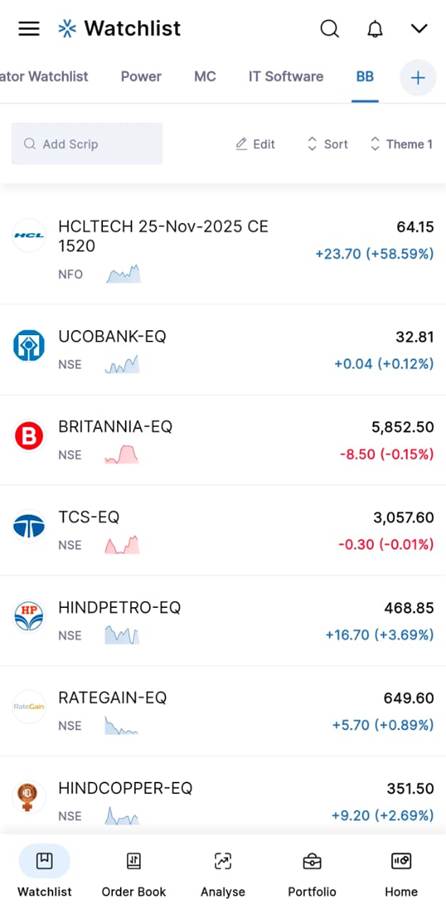
4. Real-Time Market Watch: Customizable watchlists with live streaming quotes for various instruments.
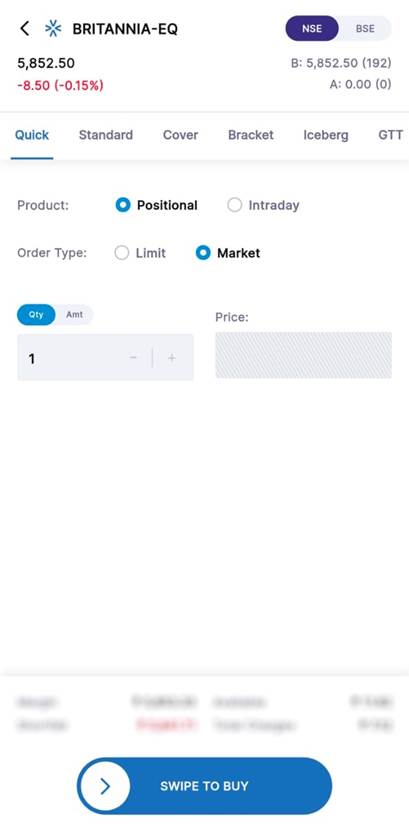
5. Order Management: One-click trade execution, auto-slice orders, and quick order placement from “Buzzar” (market scanner).
6. Portfolio Monitoring: Real-time tracking of open positions, order books, trade books, and holding summaries.
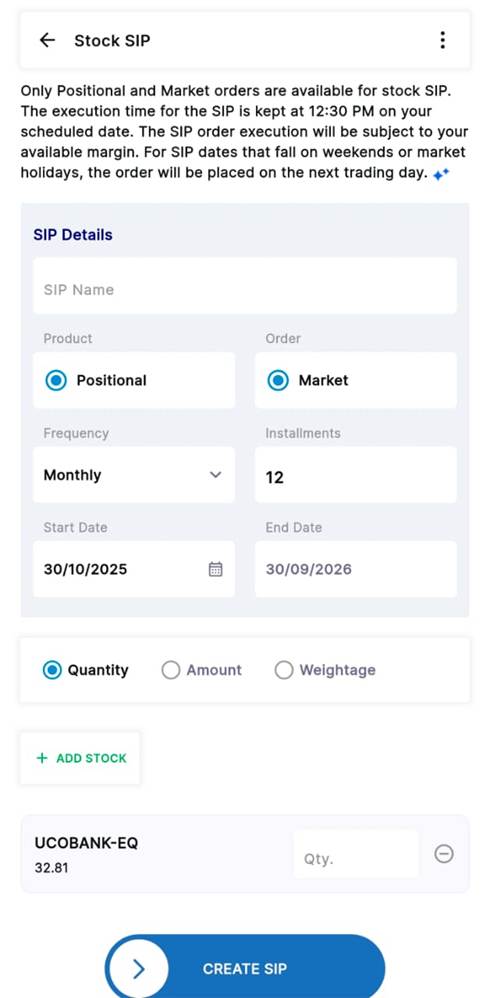
7. Stock SIP Features: Options to create and manage Systematic Investment Plans (SIPs) in stocks with flexible frequencies (daily, weekly, fortnightly, monthly)
8. Global Indices Tracking: Access to key global market indices directly from the app.
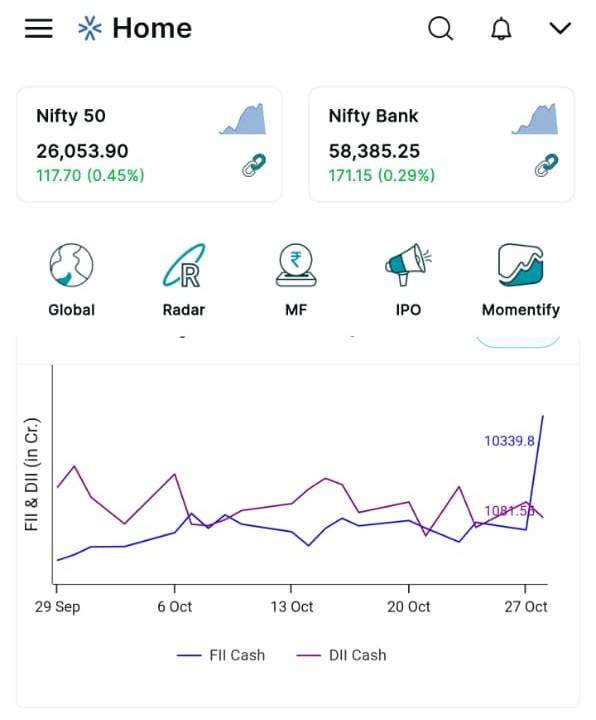
9. FII/DII Activity Analytics: Graphs and trend lines for FII (Foreign Institutional Investors) and DII (Domestic Institutional Investors) activity in both derivative and cash segments, including percentage net index longs and value comparisons.
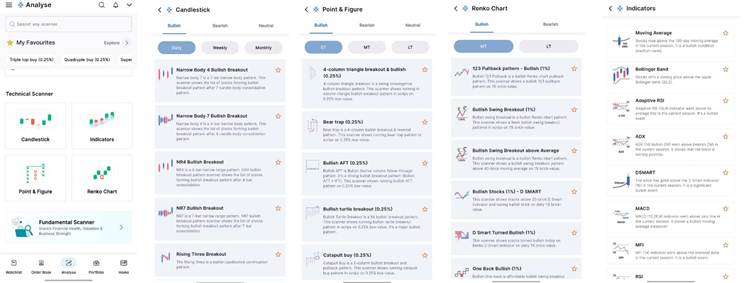
10. Scanners – Candlestick, P&F, Renko & Indicators
11. Intraday Analysis Tools:
12. Volume Analytics
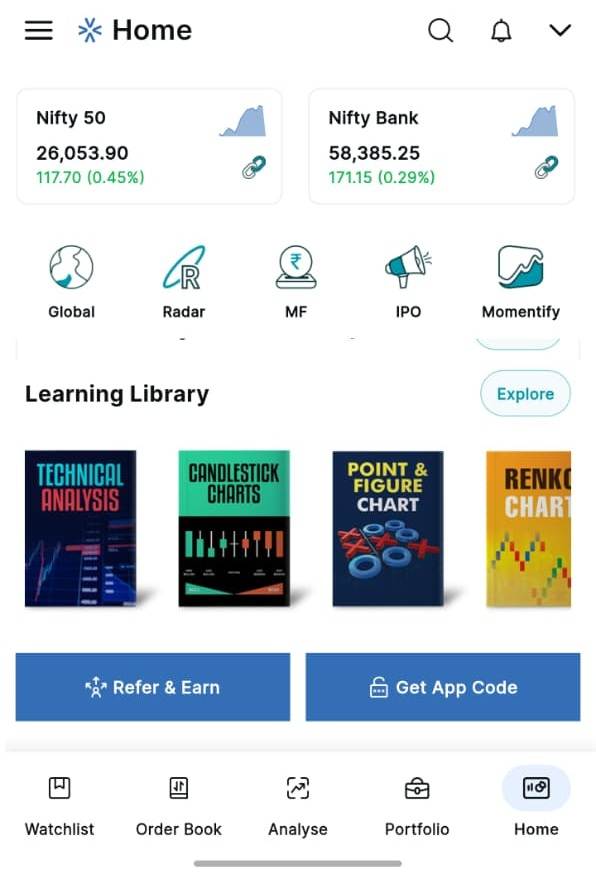
13. Learning Library Integration: Easy access to a rich educational library covering topics such as Technical Analysis, Candlestick Charts, Point & Figure Charts, and Renko Charts.
18th June 2024: Breadth Analysis
Now Zone Mobile allows you to analyse Breadth based on X%, RSI and MAs for all sectors from NSE and Definedge sectors.
Here is a quick introduction to Breadth analysis.
Click Here to learn more.

18th June 2024: Nifty Analysis
This section gives you a complete technical report on Nifty. The report will show Breadth overview, performance, candlestick patterns, P&F patterns, Renko chart patterns, Line-break chart patterns, RS commetary, seasonality performance data of the month and commentary on important indicators. It also scores the stock based on 120 parameters. The D Score is calculated using candlestick charts, point and figure charts, renko charts, and other charting methods. Several channel indicators, momentum indicators, trend following indicators, oscillators, volatility, congestion indicators, performance indicators, noiseless patterns, time cycles, and relative strength studies on different timeframes are taken into account. The score ranges between 100 and -100. A score below 0 indicates bearishness, while a score above 0 indicates bullishness. Scores above 50 show bullishness with high momentum. Scores above 90 indicate very strong bullish momentum. A score below -50 indicates bearishness with a high momentum, while a score below -10 indicates strong bearish momentum.

18th June 2024: Updated Technical Report
We have added D score meter in all D Reports. This gives you an indication of how bullish or bearish that particular scrip is. To know more about how D Score is calculated please click here.

18th June 2024: Indicator Scanners in Scanners Tab
We have added Indicator Scanner within the Scanners tab, enabling you to scan for specific technical indicator scenarios. This feature helps in identifying stocks that meet predefined technical criteria, enhancing efficiency in stock selection and trading strategies.

18th June 2024: Intraday Scanners under Scanners Tab
Intraday Scanners have been introduced under the Scanners tab to help you identify potential opportunities within the same trading day. These scanners analyze real-time market data to pinpoint stocks showing specific intraday patterns, scenarios or movements.

18th June 2024: Delivery Volume Scanner
In our latest update we have added the Delivery Volume Scanner in Scanners Tab, exclusively applicable to the NSE market. This new scanner allows you to select a group of stocks and perform a scan to gain insights into trading activity. The scanner displays both the total volume and the percentage of that volume that was 'Delivery' during the trading session for all stocks in the selected group. You can easily sort stocks by the highest delivery percentage, helping to identify stocks with strong bullish trends. Conversely, stocks with a low delivery percentage indicate higher speculative activity.

18th June 2024: Holdings as Watchlist
Now, automatically a watchlist is created containing all of your holdings simplifying portfolio monitoring by allowing you to track your investments alongside other watchlists.

27th April 2024: New "Options Tab"
With the latest update, a new "Options" tab has been integrated into the Buy/Sell window. By selecting this tab, you can conveniently place multiple orders for options of the selected scrip. This simplifies the process of trading options, thereby improving the overall user experience.

27th April 2024: "My Portfolio" as a Watchlist
Now introducing "My Portfolio" as a dedicated watchlist feature. Easily monitor all the scrips from your portfolio in one convenient location.

27th April 2024: Charting Made Personal
Introducing the Save Template feature, helping you to save indicator and configurations effortlessly. Now, you can save your preferred indicators and settings with ease, ensuring swift access.

27th April 2024: Voice Your Search
Introducing voice-assisted scrip search functionality, enabling you to search for scrips using voice commands. Simply click on the mic button in the search bar and speak the name of the scrip you wish to find.

30th November 2023: Introducing the Average Line in Intraday Nifty 50 and Nifty 500 Breadth Charts
Get a better understanding of market trends with the new Average Line in our Intraday Nifty 50 and Nifty 500 Breadth Charts.

30th November 2023: NSE Intraday Advance-Decline Chart
Keep track of market movements with the new NSE Intraday Advance-Decline Chart. This chart provides a real-time overview of advancing and declining stocks, enabling you to assess market breadth dynamically throughout the trading session.

2nd October 2023: Fundamental & Technical Scanners
This release brings two new exciting features: Fundamental and Technical Scanners.
With this addition we aim to enhance your trading and investing experience and provide you with more powerful tools.
Real-time scanning of major candlestick patterns on daily, weekly, or monthly timeframes. Includes bullish, bearish, and neutral patterns.
Real-time scanning of basic P&F patterns on different box values (0.25%, 1% and 3%) on daily timeframe. Includes bullish and bearish patterns.
Real-time scanning of basic Renko patterns on different brick values (0.25% and 1%) for daily, weekly, or monthly timeframes. Includes bullish and bearish patterns.
Real-time scanning of major technical indicators on the daily timeframe. Includes Volume, Moving Average, RSI, ADX, D Smart, MFI, MACD, Supertrend, Adaptive RSI, Stochastic, and Bollinger Bands. Also includes breakout scanners like 52-week high-low, all-time high-low, and more.
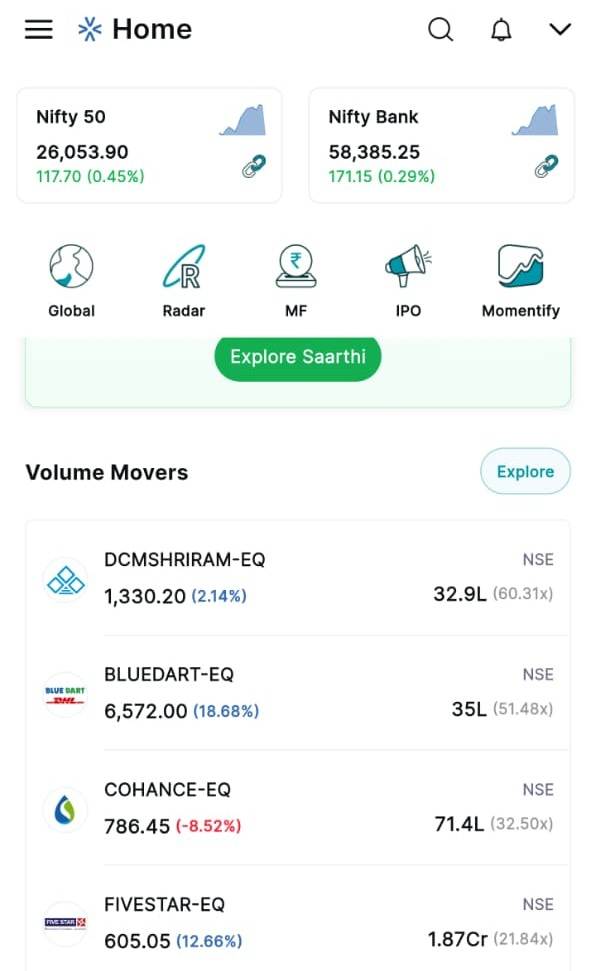
Real-time scanning of stocks with volume above the 20-day moving average in the current session (Nifty 500). Stocks are ranked based on volume multipliers.
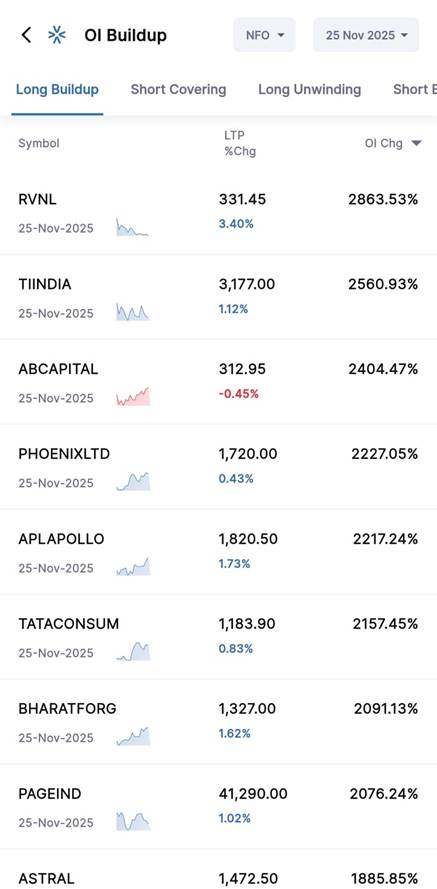
Provides real-time information on stocks with long buildups, short-covering, long unwinding, and short buildups in futures symbols. Option to select an expiry date.
Measures the relative strength of stocks in the Nifty 500 group across multiple timeframes and scores range from 0 to 1500, with top-performing stocks appearing at the top of the list. This will be useful for both short-term and long-term trading.
Real-time scanning of Nifty 500 universe to identify stocks at 52-week high/low.
Real-time list of top gainers and losers in the Nifty 500 universe.
Identifies stocks with strong momentum and showing outperformance in the current session. This also identifies stocks for continuation breakout strategies.
Provides intraday breadth chart for the Nifty 500 universe. This indicates the percentage of stocks in a bullish swing during the day, offering insights into market sentiment.

2nd October 2023: Basket Order
In response to user feedback and to streamline your trading experience, we have introduced the highly anticipated Basket Order feature. It allows you to manage multiple orders with ease, offering greater control and flexibility in your trading strategies.

10th August 2023: Introducing Technical Analysis Report
Get access to live technical insights, performance analysis, P&F, Renko and other chart observations and more right at your fingertips.

9th July 2023: Introducing the latest update to Zone Mobile App, packed with new features and enhancements to enhance your trading experience.
Here's what's new in the latest update:
UI Updates: We have revamped the UI of the Zone Mobile App to provide a more modern and intuitive trading experience. Enjoy a sleek and refreshed design that enhances usability and makes navigation smoother than ever.

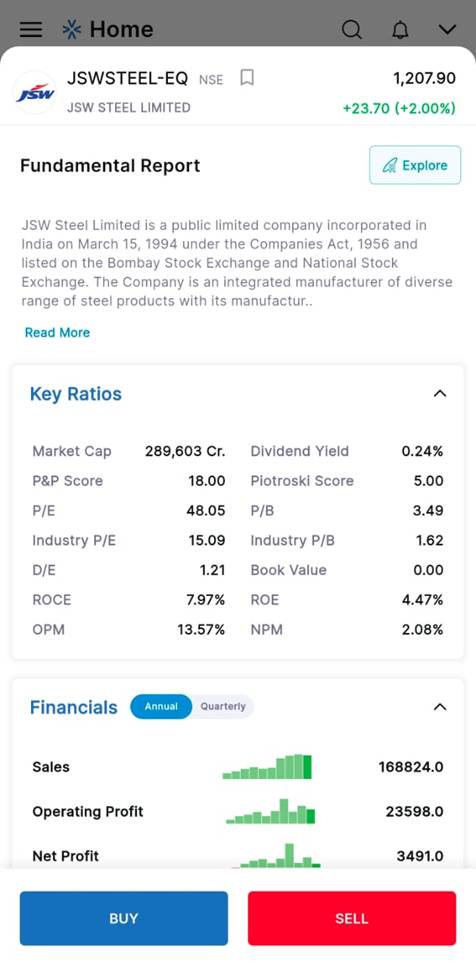
Fundamental Analysis Report: Introducing the new Fundamental Analysis report! Gain insights into the financial health of listed companies. Access comprehensive ratios, performance and more, all conveniently organized within this dedicated report.

Theme Customisation: Personalise your trading experience with our new theme customisation option. Choose between the "New Theme (Theme 1)" or stick with the "Old Theme (Theme 2)" for a familiar and classic interface.

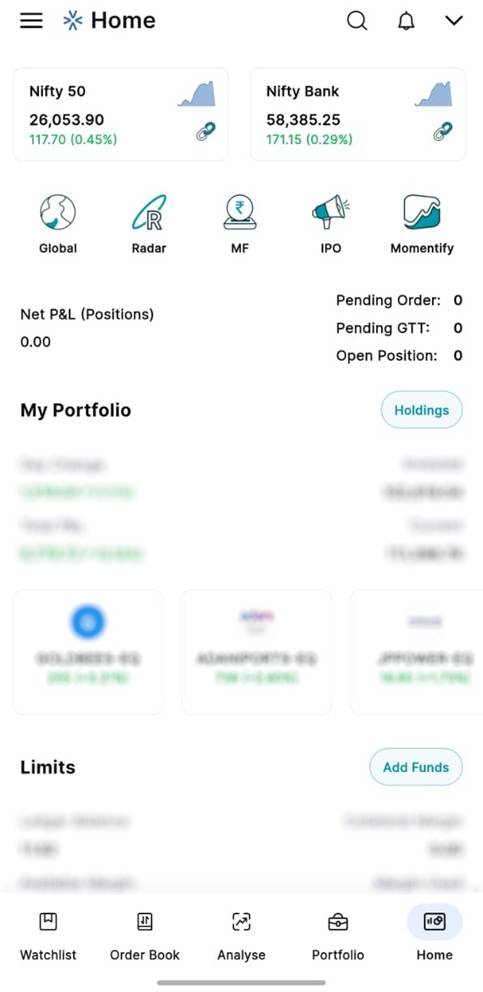
Updated Dashboard: The dashboard has undergone significant enhancements. Now, you can easily view your portfolio. Additionally, you can add funds, get App Code and also visit our Refer & Earn page directly from the dashboard.

Indices Addition: We have added major indices to the app, (Nifty 50, Nifty Bank, SENSEX and India VIX). Stay updated with real-time data on these indices, allowing you to track the overall market performance.

Revamped Option Chain: We have redesigned the Option Chain tab.
