Customer Support : 020-61923200, [email protected] | Call and Trade : 020-61923220

New Feature Releases in OPSTRA Mobile App
13th Nov 2025:
A) Opstra Mobile New Dashboard
1. Market Data, Quick Menu, Net Positions and Open Interest
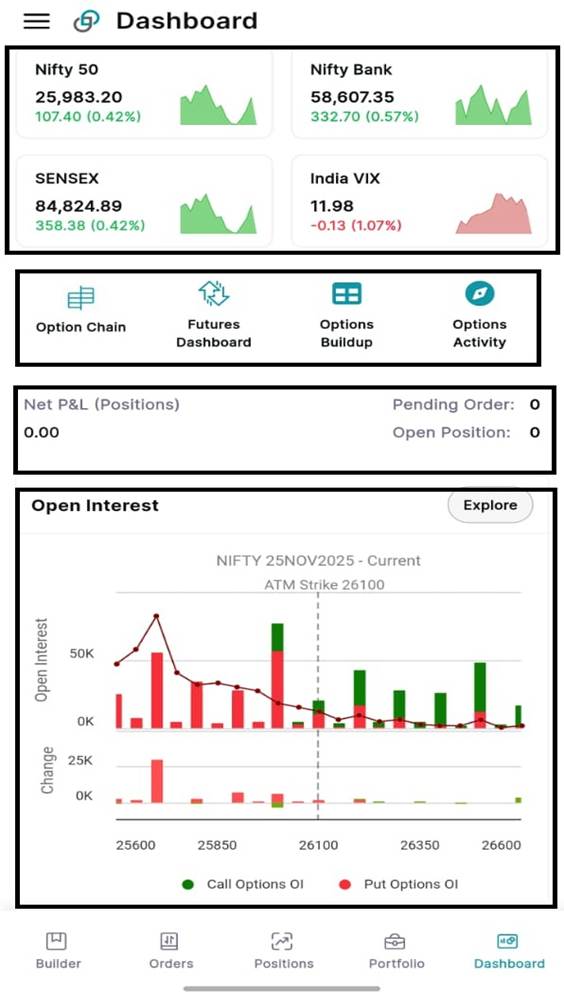
The new avatar of the Opstra Mobile offers the new dimension of:
a. Market Data of the price of Nifty, Nifty Bank, Sensex and India VIX
b. Your favourite features of Opstra like Option Chain, Futures Dashboard, Options Buildup and Options Activity are at a single click
c. Check your Net Positions as soon as you start the application
d. Analyse Nifty based on Open Interest at a glance
2. Unusual Options Activity & Top OI
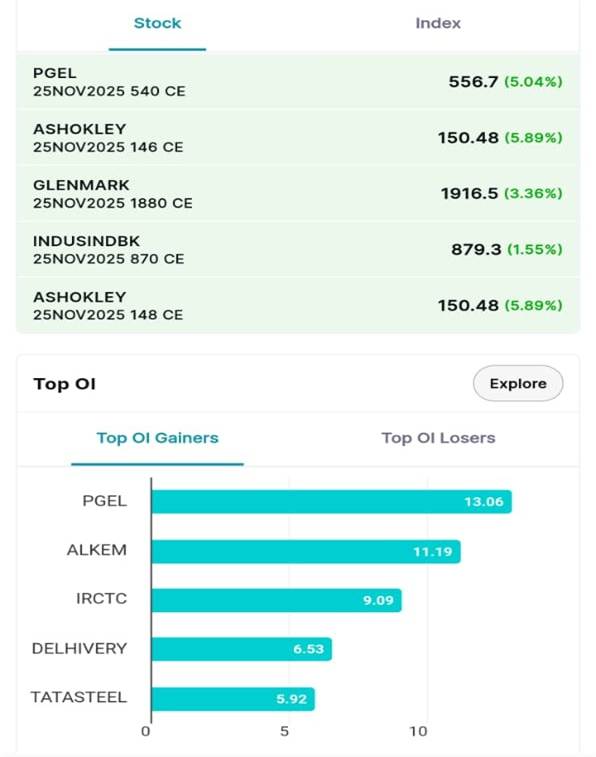
Check the stocks that have Unusual Options activity giving derivatives traders the edge to find the stock in momentum.
Also check the Top OI Gainers or Top OI Losers based on the options activity.
3. Put Call Ratio (PCR)
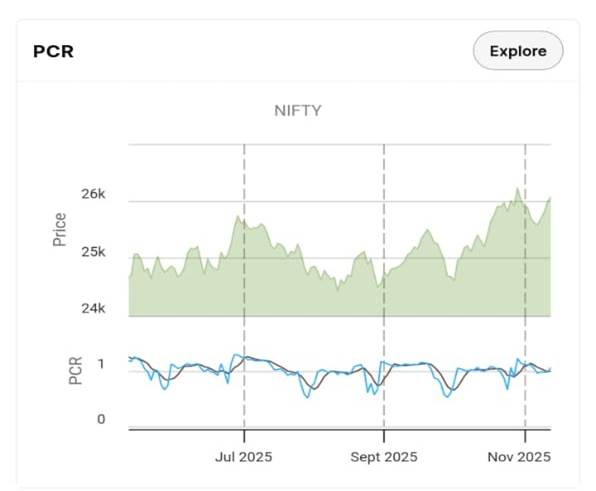
The Put Call Ratio (PCR) is a ratio that compares the open interest of put options to call options. It shows whether more traders are expecting Nifty to go up or down as options is termed as writers game.
4. FII Activity (Derivatives)
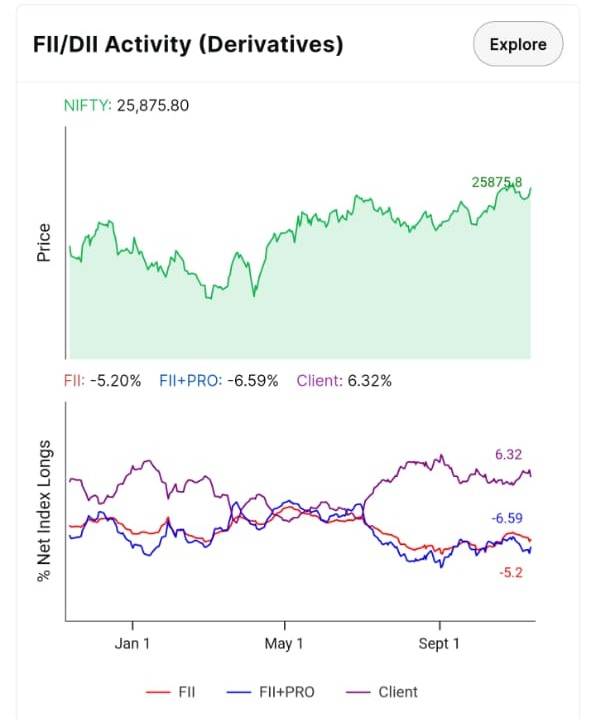
Check the FII positions on the index, Pro Positions and Client Positions in derivatives at a glance on the chart-based format offering the clients to build their positions accordingly.
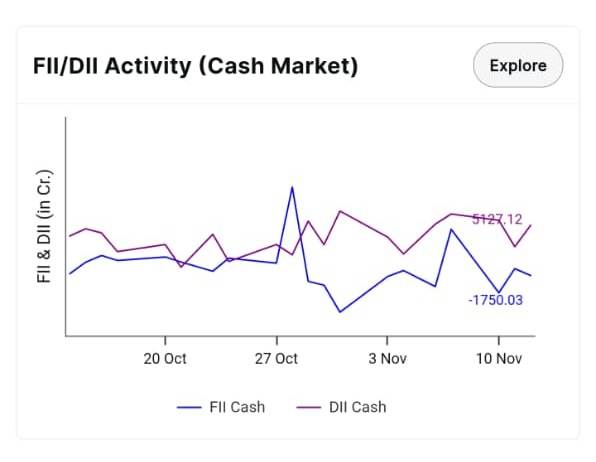
5. FII-DII Activity (Cash Market)
The FII and DII are active participants of the market and their buying and selling can lead to market rally or fall. Keeping track of their activity helps traders to position them in the market trend.
B) New Menu – Options loaded with New Features
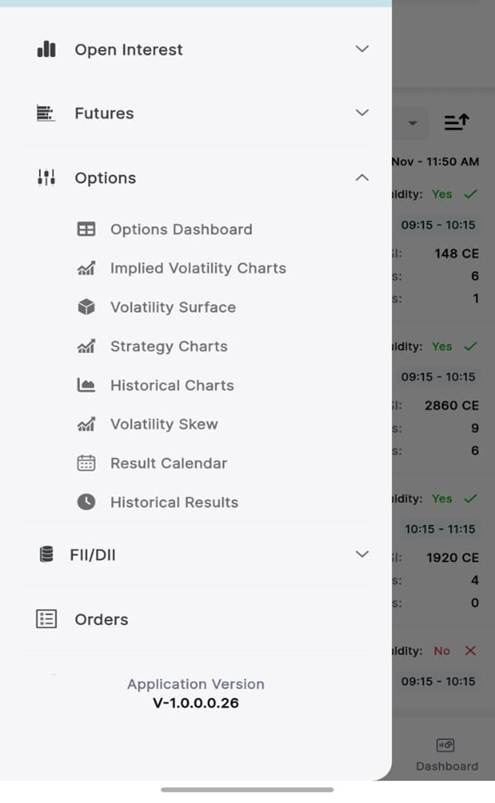
1. Options Dashboard
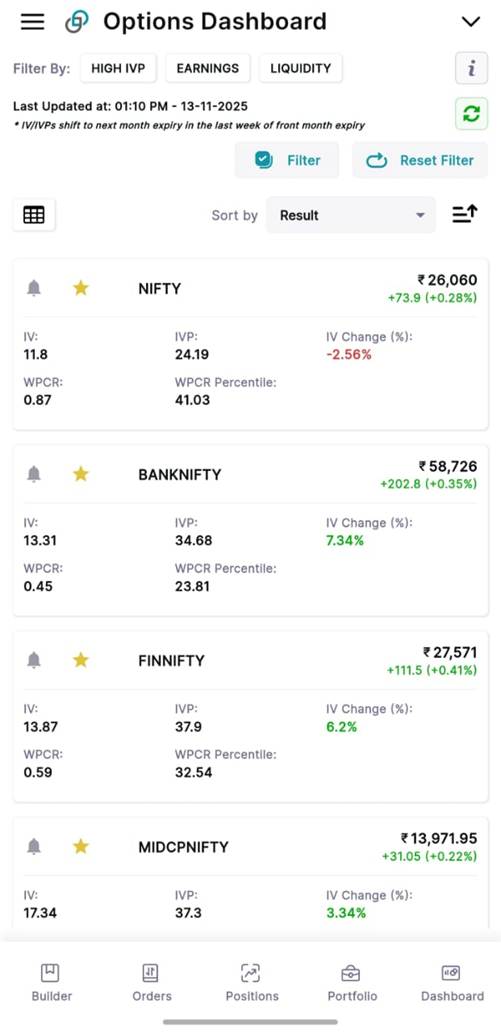
Options Dashboard offers a list view of all FNO Scrips for their LTP, IV and changes in those values along with IVR and IVP. It also gives a tile view, which, in turn, you can filter according to High IVP, Earnings and Liquidity.
2. Implied Volatility Charts
IV Charts feature provides Daily candlestick charts on the EOD timeframe along with line charts of IV, Historical Volatility, and IV-RV spread. It has an intraday line chart as well.

3. Volatility Surface & Heatmap
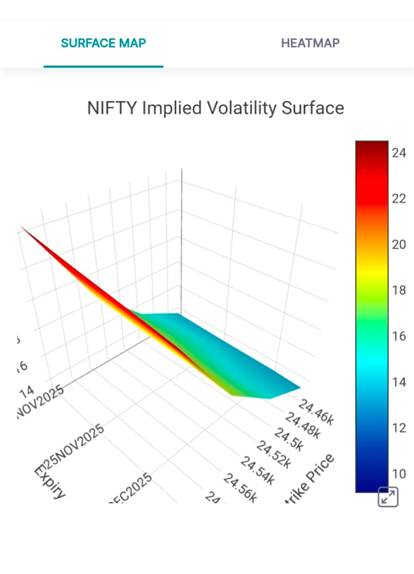
Volatility Surface offers a 3D representation of IV values of OTM strikes of various Expiries in a single frame.
Also check the Heatmap for the four expiries.
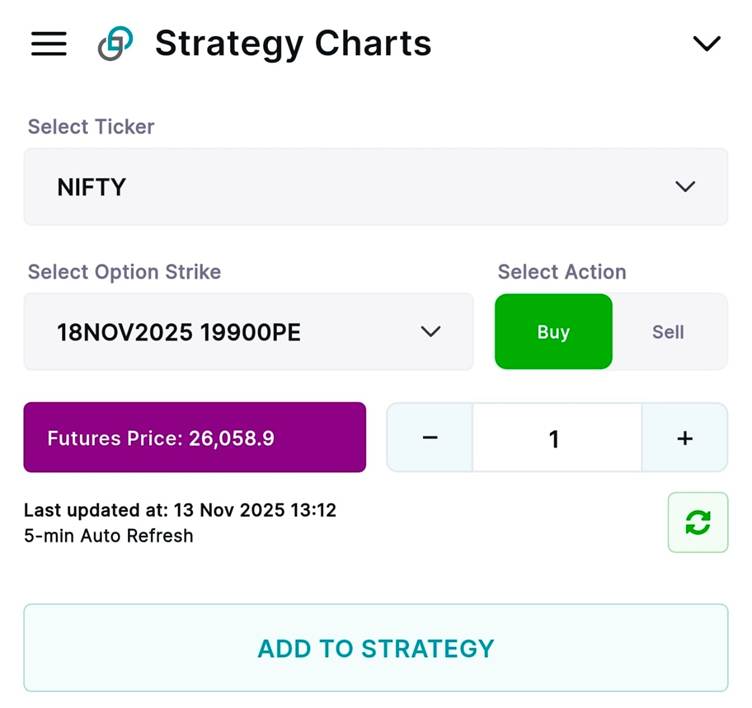
4. Strategy Charts
Strategy Charts feature enables you to create a line chart of combined LTP of multiple long and short strikes of any user-defined strategy.
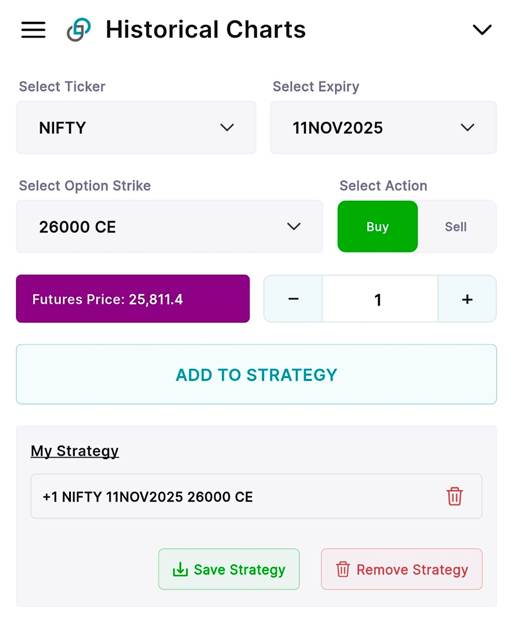
5. Historical Charts
Historical version of strategy charts where you can create your strategy for expired options.
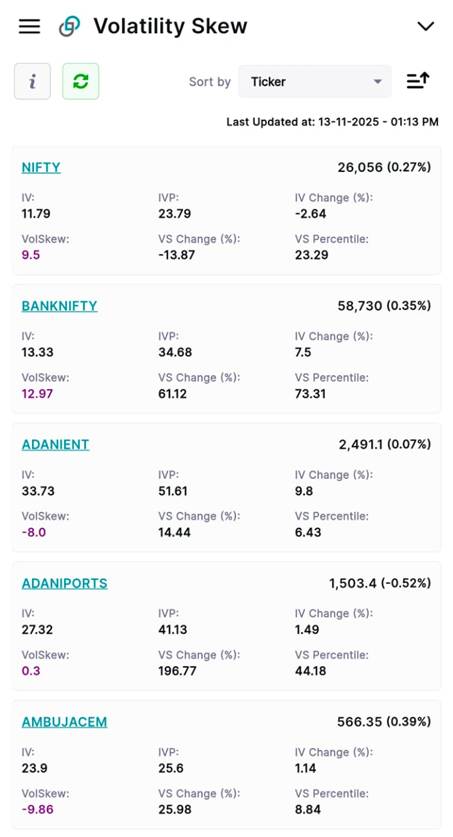
6. Volatility Skew
Volatility Skew is a table of various tickers showing values of Volskew, its change in percentage and VS Percentile, and IV values, its change in % and its percentile.
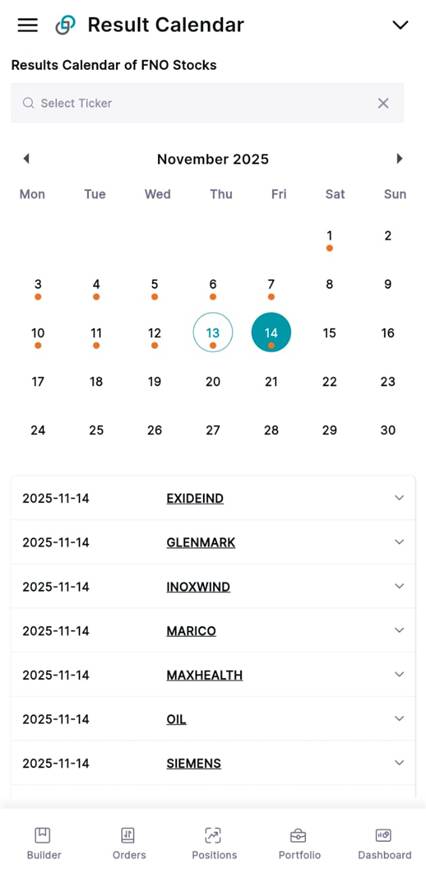
7. Results Calendar
It gives a Calendar with all the scheduled Quarterly / Annual Results for the FNO Stocks. In this section, you can search results of a particular Stock along with the declaration time for their historical results.
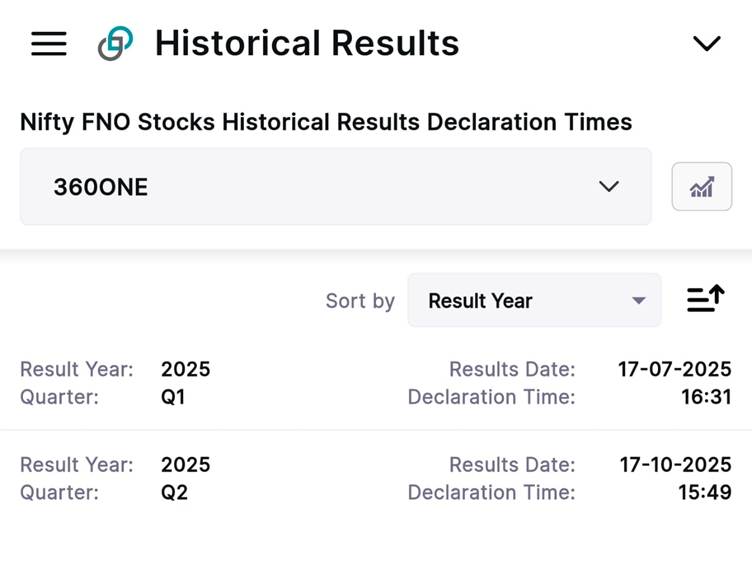
8. Historical Results
This feature provides you with the list of Historical Records for any selected Stock and the declaration time.
16th June 2025: Futures tools now available in Opstra app. Also, track FII/DII data for informed decisions.
Futures Tools -
Futures Dashboard

Futures open Interest

Futures Intra-Day

Futures Buildup

Heatmap

Moving Averages

FII/DII -
FII/Dll Cash Market

FII/Dll Derivatives

3rd Feb 2025: All features in Open Interest Menu now available on Opstra Mobile App
Put Call OI Dynamics (Pro feature)

Open Interest Charts (Pro feature)

Options Buildup (Pro feature)

PCR (Available in Basic Plan)

Straddles (Pro feature)

Option Chain (Available in Basic Plan)

Unusual Options Activity (Pro feature)

TRIVIDH (Pro feature)

Open Interest Crossover (Pro feature)

Options Activity (Pro feature)