Customer Support : 020-61923200, [email protected] | Call and Trade : 020-61923220

PMOX Momentum Strategy
PMOX Momentum Strategy
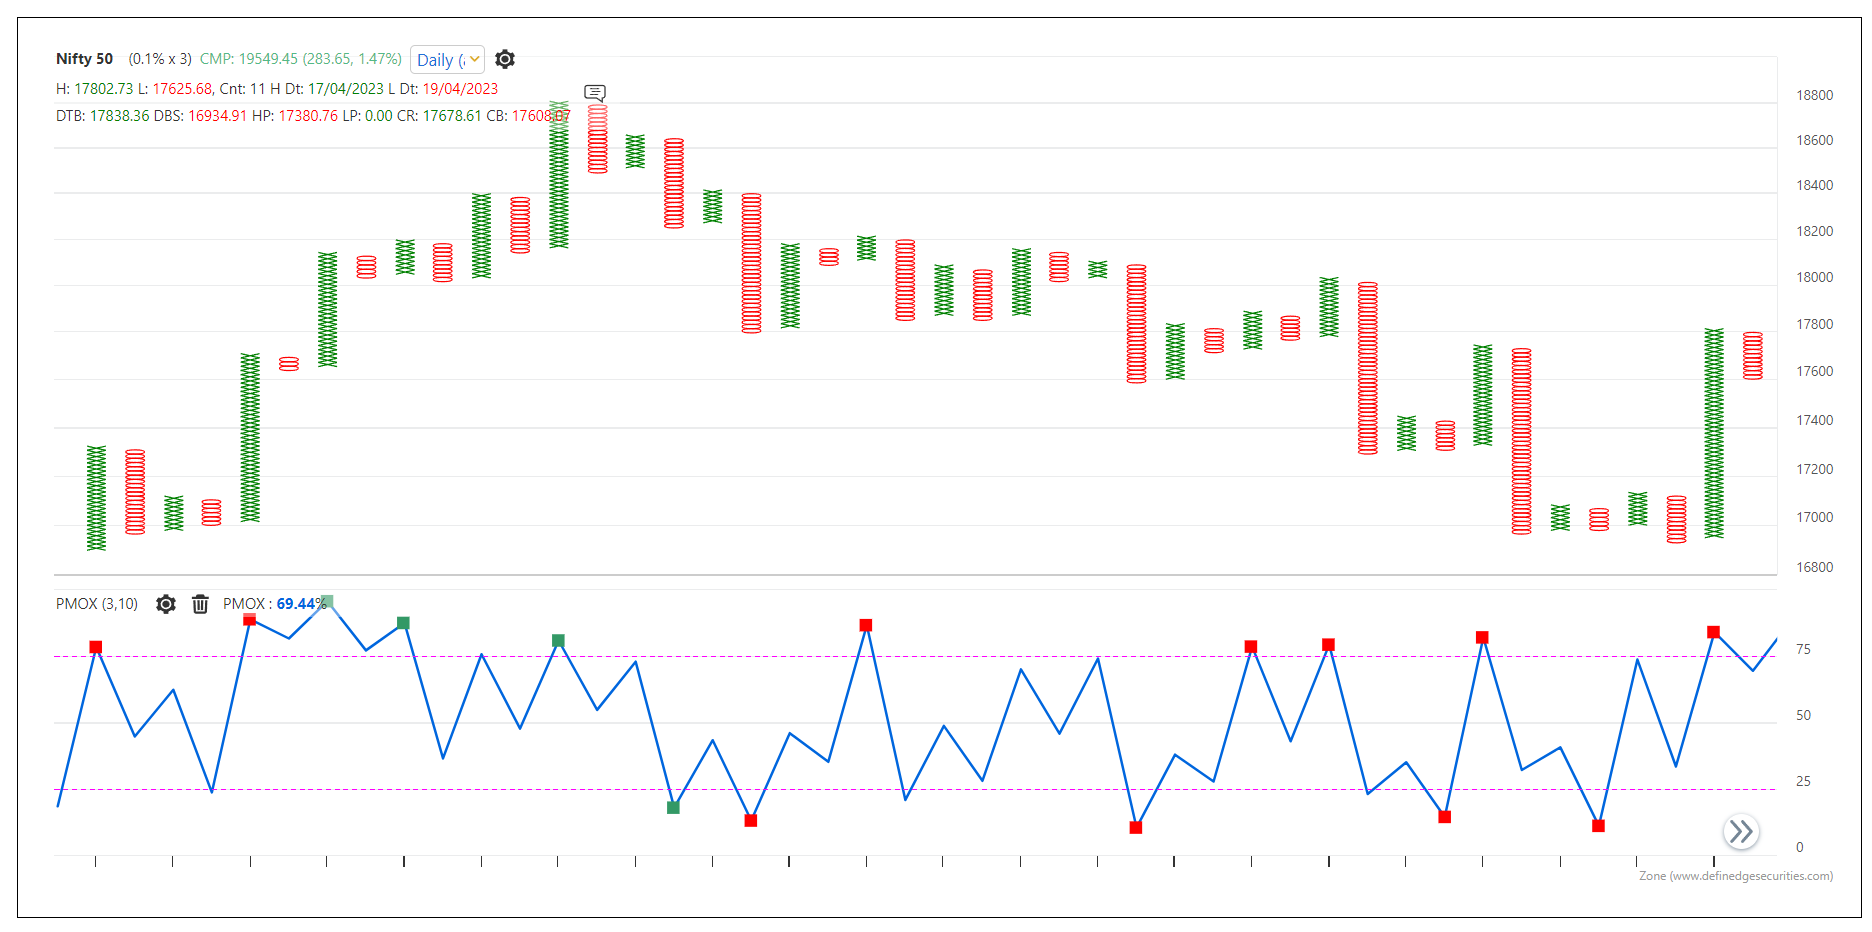
PMOX is a unique indicator developed by Definedge, based on Point & Figure (P&F) charts.
It is constructed using the Xs, Os, and vertical column structures of the P&F chart, and functions as both a momentum indicator and an oscillator. PMOX helps identify strong trends as well as pullback trade opportunities.
A common issue with many oscillators is that they remain in overbought territory even during strong market trends, making interpretation difficult. PMOX addresses this limitation by combining trend strength analysis with recent price swings.
It measures the strength of short-, medium-, and long-term trends, as well as the intensity of recent price movements.
PMOX levels of 75 and 25 are considered extreme.
Green and red dots appear at these extreme levels to signal key momentum conditions:
A green dot above 75 indicates strong bullish momentum. When the price crosses the high of the green dot column, it signals a bullish continuation breakout. A suitable stop-loss can be placed at the double bottom sell pattern or below D Smart indicator.
A red dot below 25 indicates strong bearish momentum. When the price breaks the low of the red dot column, it signals a bearish continuation breakout. A stop-loss can be set at the double top buy pattern or above D Smart indicator.
Below two strategies listed in the Popular trading strategies tab of the P&F chart.
PMOX Bullish Momentum Breakout
With this scanner, you can scan stocks that have generated a PMOX bullish momentum dot breakout.
PMOX Bearish Momentum Breakout
With this scanner, you can scan stocks that have generated a PMOX bearish momentum dot breakout.
There are two options in P&F chart scanners: Running and Fresh. In the running scanner option, you will see a list of candidates that have formed a PMOX bullish momentum breakout and are still running in the same column. If you select the Fresh option, you will only be presented with candidates who meet the condition during the current session.
This strategy applies to all box values, timeframes and instruments.
Momentify Trading Setup
Below is a possible strategy for using PMOX in the Momentify Trading setup. Positional Long Only Strategy.
Strategy Name: PMOX Momentum Strategy
Stock Group: Your choice
Allocation: Your choice
Number of Stocks: Your choice
Rank Criteria: Return Percent or Volar
Position Size: Fixed
Ranking Period: 20 & 252
Retracement: Within 50% of 52-week high
Moving Average Filter: 200-EMA
TMA Trend: Bullish 20, 50, 100 triple moving averages trend
Trend Quality: Above 50%
Relative Strength: Above D Smart
Entry Condition: PMOX Bullish Momentum Breakout
Exit Condition: Below D Smart
Market Trend Filter: Change the exit strategy to Double Bottom Sell or High Pole when Nifty turns bearish, or when X% breadth rises above 75, or X% breadth falls below its moving average..
Please note: When using Point & Figure charts, the box-value can be defined based on the stock universe:
- 0.25% x 3 for large-cap stocks
- 1% x 3 for other stocks
- 3% x 3 for medium- to long-term trading setups
You can run this strategy on large-cap, mid-cap, small-cap, micro-cap, or the entire market universe. It can also be applied to various sectors, thematic indices, or even your own custom group of stocks.
In the above template, position sizing is kept as fixed. However, you can also opt for ATR-based or Risk-based position sizing methods.
It is important to understand that the above rules are meant to help you understand the structure of the template. You are encouraged to tweak the parameters as per your comfort, and backtest across different time periods and stock universes to build your own customized trading template.
You can customize the exit strategy — including setting your preferred stop-loss percentage and target levels.
You can use this base template, make necessary adjustments, and save it in your Momentify Trading dashboard.
To backtest your strategy, go to:
RZone → Backtesting → Momentum Trading Backtesting
The above strategy in the Momentify Trading Setup is a long-only (buy-only) strategy and can be applied across any market segment — cash or derivatives, across any timeframe or instrument.
In Momentify trading setups, there are two options: Fresh and Running.
- Running: Displays stocks that qualified earlier and are still running in the same column. These stocks are ranked based on the selected ranking criteria.
- Fresh: Shows only those stocks that qualify the setup on the current day, also ranked based on the selected criteria.
The stock basket in Momentify is generated based on the previous session’s closing price.
To scan stocks using live market prices, simply click the Scan button.