Customer Support : 020-61923200, [email protected] | Call and Trade : 020-61923220

Multi-Year Breakout Strategy
Multi-Year Breakout Strategy
The core idea of this strategy is simple:
To identify and participate in early-stage trends driven by strong momentum
We focus on stocks that:
- Are trading at or near 52-week highs or all-time highs
- After a long consolidation period of 3 to 5 years or more
- Have formed a strong base (higher base formation)
- And are breaking out with strength
When a stock consolidates over a long period:
- Supply gradually gets absorbed
- Weak participants exit the stock
- Strong hands accumulate positions
When the stock finally breaks out:
It enters a new price discovery phase
There is no overhead resistance
Fresh demand starts pushing the price higher
This is where a new trend begins, and this strategy aims to capture that phase.
Volume plays a supporting role in this strategy.
- Higher volume indicates strong participation
- However, it is not a compulsory condition in every case
- It is more prominently visible in midcap and small-cap stocks
This strategy is not about predicting the market.
It is about:
Identifying strength
Participating in confirmed momentum
Riding the trend as it develops
We are essentially trying to capture the early phase of a new trend
This strategy performs best under the right market conditions.
It works best when:
- The overall market is in a bull phase
- Or when a specific sector is trending strongly
- Markets are showing clear directional movement
It struggles when:
- The market is sideways or choppy
- In Correction time
- There is a lack of clear trend
Stock Selection (Universe)
To make the strategy more effective, it is important to define a clear universe.
Preferred universe:
- Midcap and Small-cap stocks
These segments generally offer:
- Better momentum opportunities
- Stronger price expansion during breakouts
How to Filter Stocks
- Focus on stocks making 52-week highs or all-time highs
- Avoid illiquid or low-quality stocks
- Prefer stocks with clean price structure
Setup Identification
The setup for this strategy is simple, but powerful.
We are looking for the following:
Key Elements of the Setup
Long Consolidation Phase
- Minimum 3 to 5 years
- Clear base formation
Multi-Year Resistance Level
- Clearly visible on the chart
Breakout with Strength
- Strong price movement
- Preferably supported by volume
Timeframe to Use
- Weekly charts (primary)
- Monthly charts (for broader perspective)
These higher timeframes help in identifying high-quality, long-term setups and filtering out noise.
Chart Configuration
The following standardized settings are used:
- Chart Type: Point & Figure
- Box Size: 1%
- Reversal Size: 3-box reversal
- Timeframe: Daily
Entry Rules (Rule-Based)
Entry in this strategy is strictly rule-based, ensuring there is no emotional or discretionary bias.
Entry Condition
A stock qualifies for entry when:
A Bullish Turtle Breakout above D Smart
What is Bullish Turtle Breakout?
A Bullish Turtle Breakout occurs when the current column of Xs exceeds the highest X formed in the previous five columns.
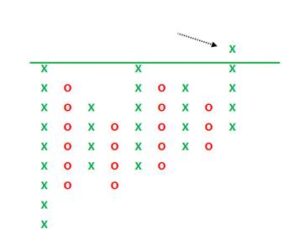
This indicates that:
- Demand is overpowering supply
- The stock is entering a fresh breakout phase
What is D Smart?
D Smart is a proprietary indicator developed by Definedge.
It is a combination of multiple studies:
Unlike most indicators, it adjusts its slope dynamically based on the trend and prevailing market conditions.
Its formula also incorporates the underlying chart construction method, making it adaptive by design.
As a result, it is perhaps one of the few indicators that is built differently across charting methods.
The D Smart indicator accounts for multiple market dimensions—
trend, trend strength, volatility, range-bound conditions, breakouts, and both temporary and major reversals.
Exit & Trailing Rules
The exit strategy is designed to protect capital and ride long trends.
Exit the position when price moves below D Smart (6-period)
Trailing Mechanism
- The D Smart (6-period) acts as a dynamic trailing stop
- As the trend progresses, it helps in:
- Locking in profits
- Staying invested during strong trends
- Avoiding premature exits
Objective of Exit Rule
- Cut losses when trend weakens
- Stay invested as long as the trend remains intact
Strategy Summary
The Multi-Year Breakout Strategy (Momentum Investing) is built on a simple but powerful principle:
Strength attracts strength
This method focuses on identifying stocks that are:
- Breaking out of multi-year resistance levels
- Trading at 52-week highs or all-time highs
- Showing strong price momentum
- Supported by structural demand
Using a Point & Figure based rule system, the strategy ensures:
- Objective entries through Turtle Breakouts
- Trend alignment using D Smart
- Disciplined exits and trailing
- Consistent portfolio construction through equal position sizing