Customer Support : 020-61923200, [email protected] | Call and Trade : 020-61923220

Intraday Momentum Trading Strategy: FAST Universe
Intraday Momentum Trading Strategy: FAST Universe
Trading stocks in action or momentum is an important aspect of intraday trading.
Below is a strategy that explains a method to trade intraday in stocks, futures and options based on the underlying.
Its a FAST method of trading the stocks.
FAST stands for:
- Follow-through
- Anchor instrument
- Small stop-loss
- Trend filtration
The method involves trading stocks based on momentum and action and identifying affordabel trade setups in them.
Stocks in action are generally stocks with high volume or stocks in the news. It is difficult to scan for stocks in the news, but your friends will tell you about them. There is a method to capture stocks in action using the Anchor column but it is discussed separately.
The list of stocks that are in action during the day can be obtained in a simple manner.
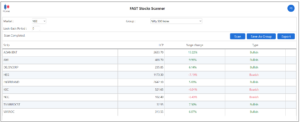
- Go to the Smart scanner section of RZone or TradePoint Desktop and click on the FAST scanner.
- Select a group of stocks and scan.
- A list of bullish and bearish FAST stocks will appear.
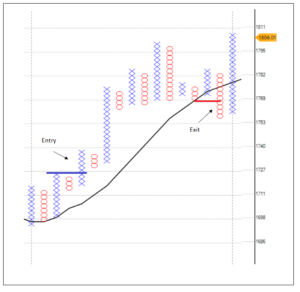
Trade simple double top buy or swing breakout patterns above moving average in these stocks during the session.
Trade Universe: FAST Stocks
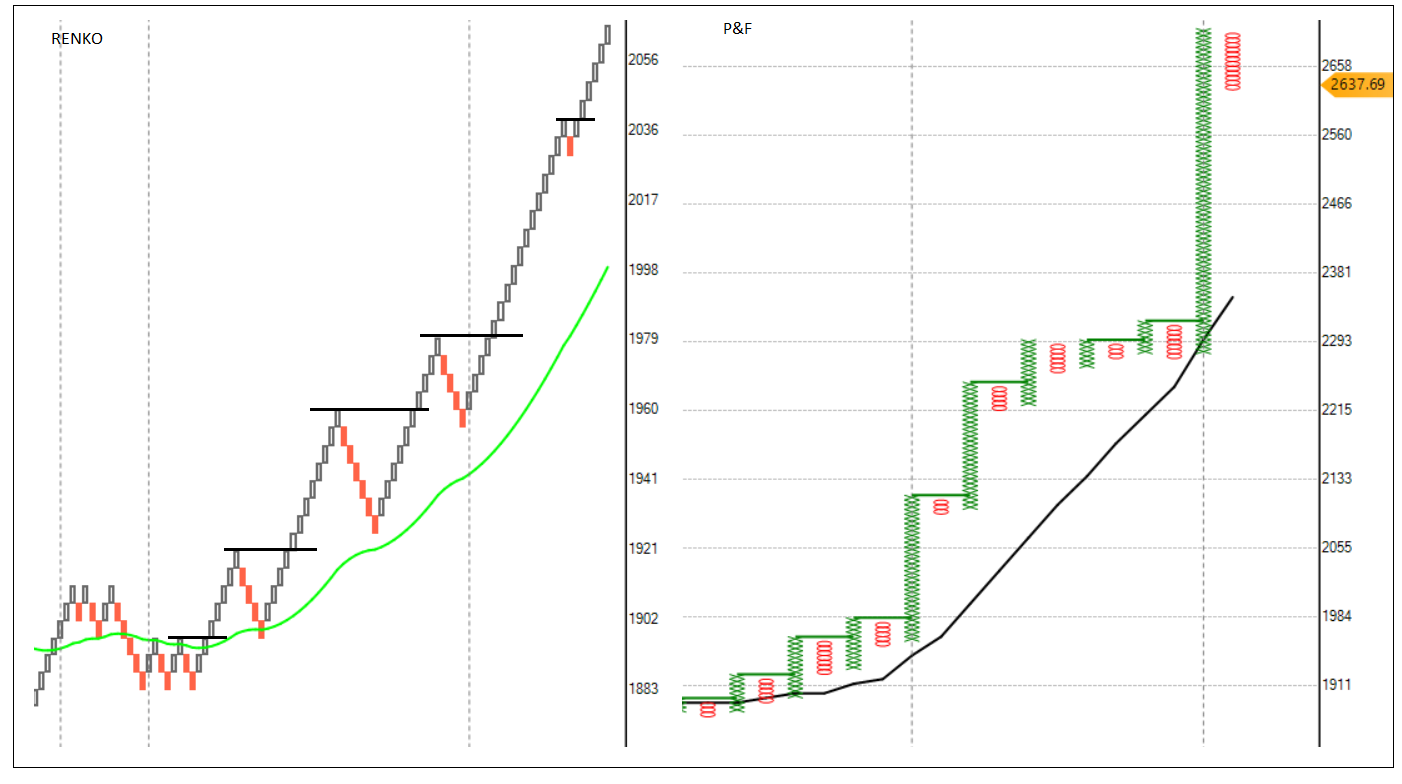
Entry: Double-top buy in P&F chart or swing breakout in Renko chart
Box size: 0.15% in P&F and 0.25% in Renko
Trend filter: 6-column D Smart on P&F chart. 30-brick D Smart on the Renko chart.
Exit: 6-column D Smart on the P&F chart. 30-brick D Smart on Renko chart. It is also possible to keep the 2% profit exit rule.
Risk Management: Not more than 3 stop losses per day
Run the scanner from 9.20 am to 3.10 pm.
Keep looking for FAST stocks in the FAST scanner after every 30 mins or 60 mins during the session.
You can run this in both the derivatives and cash segments.
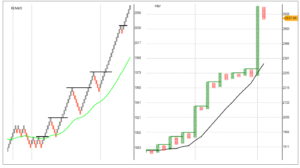
This is how the chart looks.
Steps:
1 – Run the FAST scanner (Smart Scanner -> FAST Stocks). If you are looking for derivatives, select Group as F&O. Nifty 500 if you wish to trade in cash.
2 – Save them in a group
3 – Run double-top buy scanner on P&F chart on that group. Swing breakout scanner on the Renko chart.
Exit the trade at double bottom sell pattern or when price falls below 6-column D Smart walking line in P&F chart. Exit the trade at Bearish swing breakout pattern or if brick falls below 30-brick D Smart walking line in Renko chart.
It is also possible to limit the initial risk by limiting the number of boxes before breakout to 8 boxes.
Keep risk affordable. Try trading with a small position size to see if it suits your style.
It is a pure intraday trade strategy which is objective in nature. Stock selection, entry, exit and risk management rules are clear.
It’s a momentum-directional continuation trade strategy. Performance depends on the market scenario, so don’t take risk management lightly. Follow the rules with discipline.