Momentum Period

Momentum Library

Golden & Death Crossover
Renko Reversal Patterns
Super bricks Momentum Strategy
PMOX Pullback Strategy
P&F Turtle trading strategy
Intraday Momentum Trading Strategy: FAST Universe
PMOX Momentum Strategy
Exchange and Group
Allocation
Number of Stocks (Portfolio size)
Ranking
Exit Rank
Rebalance Period
Momentum Period
Retracement
Breakout
Period Weight
Price Conditions
Volume
Chart Type
Timeframe
Entry Condition
Moving Average
Fundamental strategy
Relative Strength
Exit Condition
Stop-loss and Target
Market Trend Filter
MI Base Strategy (MIP-1)
MI Strategy (MIP-12)
MI: Indicator tadka (MIP-30)
MI: Renko tadka (MIP-35)
MI: P&F RF tadka (MIP-36)
MI: P&F RSI Tadka (MIP-37)
MI: ETF Strategy (MIP-12)
MI: Fundamental tadka (MIP-12)
MI: GSec Filter (MIP-15)
Large Cap MIP
Mid-Small Cap (MIP-12 with SL)
Micro-cap 250 (MIP-12 with SL)
P&L calculation in MI Simulator
Backtesting Statistics Explained
ETF Groups in Momentify
Market Trend Filter - Trading
Bear Trap Trading Strategy
20-High Breakout System
Ichimoku Strategy
AIT Smart Strategy
BOOST Trading Strategy
Super Trend – RSI Strategy
MIP-36 (Basic P&F Template)
MIP-35 (Renko Basic Template)
MIP-12 (Basic Trade Template)
MIP – MF (Aggressive)
MIP - MF (Moderate)
MIP - MF (Conservative)
D All-one ETF MIP
D-Asset (Monthly)
D-Asset (Weekly)
D-Segment ETF MIP (Monthly)
D-Segment ETF MIP (Weekly)
D-Sector ETF MIP (Monthly)
D-Factor ETF MIP (Monthly)
D-Factor ETF MIP (Weekly)
MAUKA Strategy (Mid-Small Cap)
MAUKA Strategy (Large-Cap)
Multi-Year Breakout Strategy
Trend Following Swing Strategy
The Laidback Strategy
PSE Sector MIP
PSU Bank Sector MIP
India Defence Sector MIP
Healthcare (Mid-Small) MIP
Capital Market Sector MIP
Oil & Gas Sector MIP
Corporate Houses MIP
CDMO Sector MIP
Power Sector MIP

Momentum Period

In the momentum investing method, stocks are ranked based on their performance, which is measured over a specific period.

The key question is: Over what period should performance be evaluated?

Research suggests that a one-year period is generally an effective measure for calculating stock performance. Our own findings also support this as the recommended period.

Since a year consists of 365 days, we express it in terms of daily active sessions to align with other market studies. In trading terms, a one-year period translates to 252 trading days. However, this period can be adjusted based on your analysis.
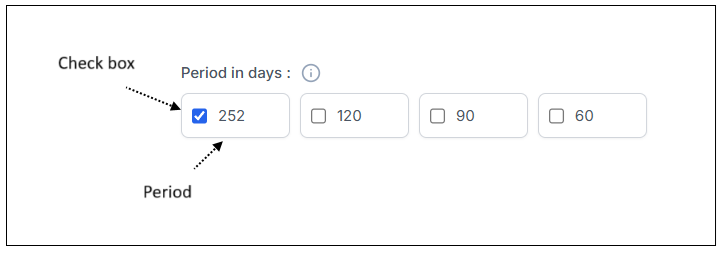
Some momentum investors also use shorter periods, such as 120-day, 90-day, or 60-day windows. Others prefer to analyse multiple periods simultaneously.
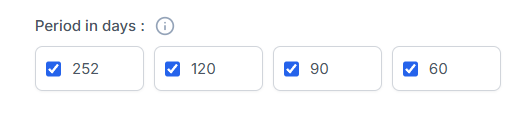
On the Momentify platform, you can select multiple periods by clicking the checkbox next to the period selection. If more than one period is chosen, stocks are ranked based on their annualized average returns across the selected periods.

252-day is a recommended period for ranking Momentum investing portfolio stocks.


Open Demat Account