Published on: December 1, 2025
Building an investment portfolio is fun, at least at first. We buy stocks based on our own research, a tip from a “expert,” or just because a lot of other people are doing it. And every retail investor has said this at least once in their life:
“I bought this stock to trade, but it went down. The company is excellent, so I am holding.”
Doesn’t that sound familiar?
Almost every Indian investor has gone through a time when they bought tens or even hundreds of stocks, and the challenge is to track them. Managing a portfolio on Excel, logging into multiple apps, comparing charts, going over the basics again… it quickly becomes a boring job. And to be honest, most investors lose interest.
But what if I told you that portfolio analysis doesn’t have to be boring or hard anymore?
With the Zone Mobile App, keeping track of your investments is so easy that you can look at your whole portfolio in just a few clicks, even while you are on the go, in queue or taking a break for chai in the evening.
If you are a Definedge client and haven’t installed the app yet, you are missing out.
After you sign in with your Client Code and Password, just click on the Portfolio tab, then Holdings, and finally Analysis.
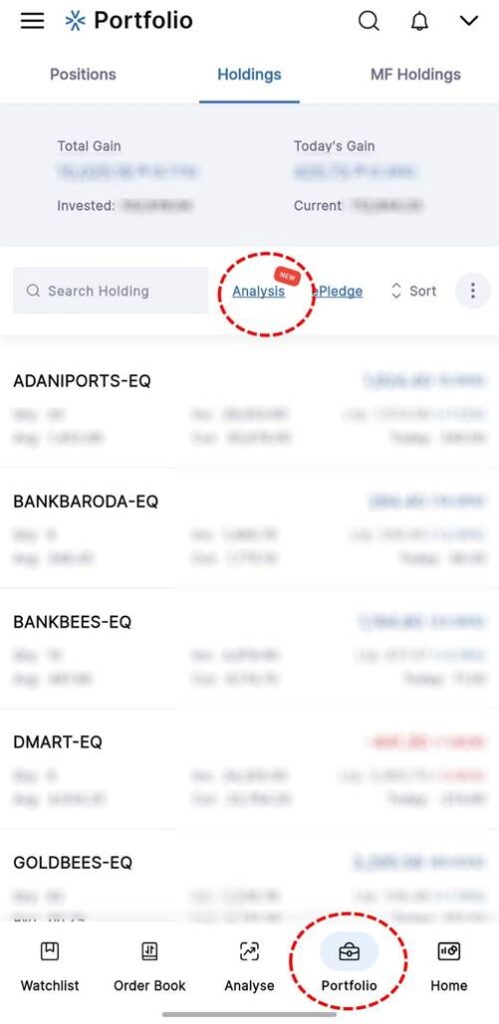
Zone Mobile has some great analytics that help traders and investors make better Buy/Sell/Hold decisions. These are not too many spreadsheets or complicated dashboards. They are a click and scrolls.
1. Perks & Pitfalls Score: A Checkup on Your Business
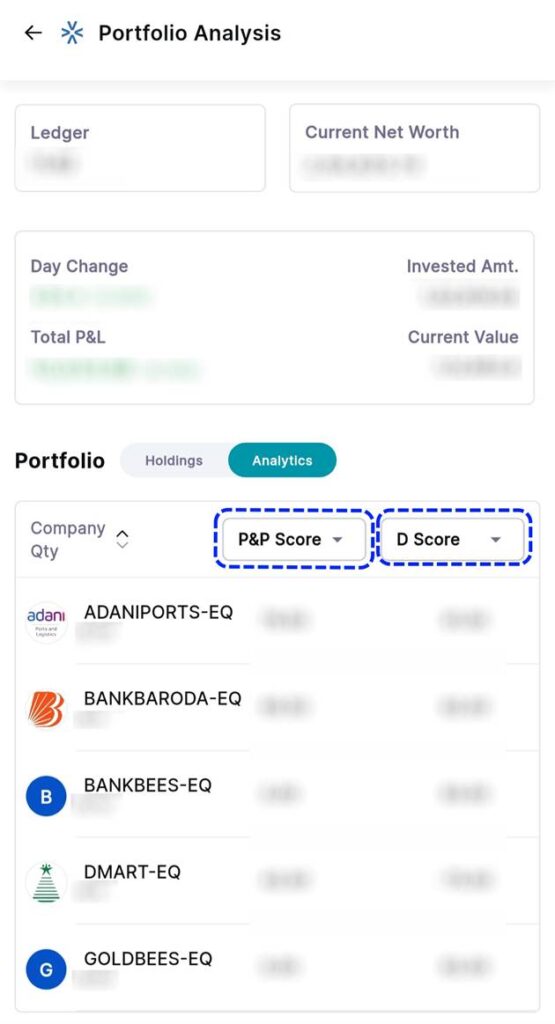
This score is like a quick doctor’s visit for your business. The Perks & Pitfalls Score shows you right away how strong the stock is financially as a whole. You don’t have to read through annual reports and balance sheets; instead, you get a quick look at whether the business is sound or showing signs of trouble.
This score is a great way for investors to get quick, reliable information before making decisions.
2. D Momentum Score: Price Speaks for Itself
Momentum is what drives markets, and it’s often the first sign of a trend.
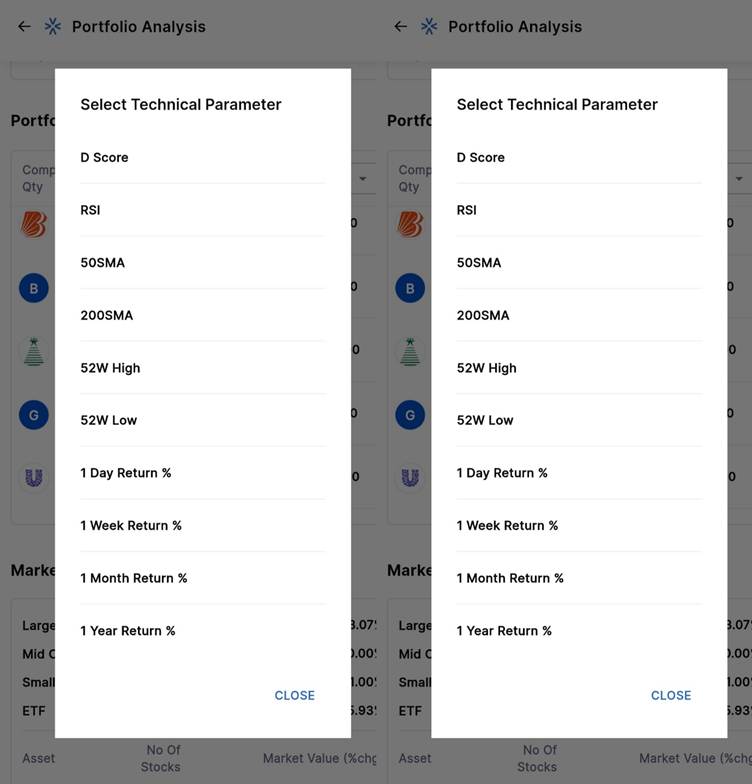
The D Momentum Score tells you if the stock is getting stronger, losing speed, or just moving sideways. This is great for traders because it lets them know if the stock still has the energy to move or if the move has already run out of steam.
You also get a lot of technical and fundamental parameters to help you make your analysis more personal.
3. Market cap Allocation: Are You Heavily on the Right Side?
It’s not enough to just own good stocks; you also need to own the right mix.
You can quickly see if your portfolio is leaning towards “large-cap giants,” “mid-cap growers,” or “small-cap performers” in the Inside Zone Mobile app.
You can easily figure out if you should stay invested in a certain market-cap segment or move your money to sectors that are doing well using tools like the RS Matrix.
This information is very helpful in a market that changes quickly, like India’s.
4. Sector Allocation: Know Where Your Money Really Goes
Sector trends can hurt or help your portfolio. A strong sector’s leadership can boost your returns, but a weak sector can quietly bring down the whole portfolio.
The Sector Allocation view shows how much of your portfolio is in each sector. Combine this with scanners and tools available in RZone—such as Sector Seasonality, RS Matrix, or D-Smart, and you can decide whether to increase or reduce your exposure.
Now, sector rotation isn’t a mystery anymore. It shows up.
5. Portfolio Performance: The Equity Curve That Tells the Truth
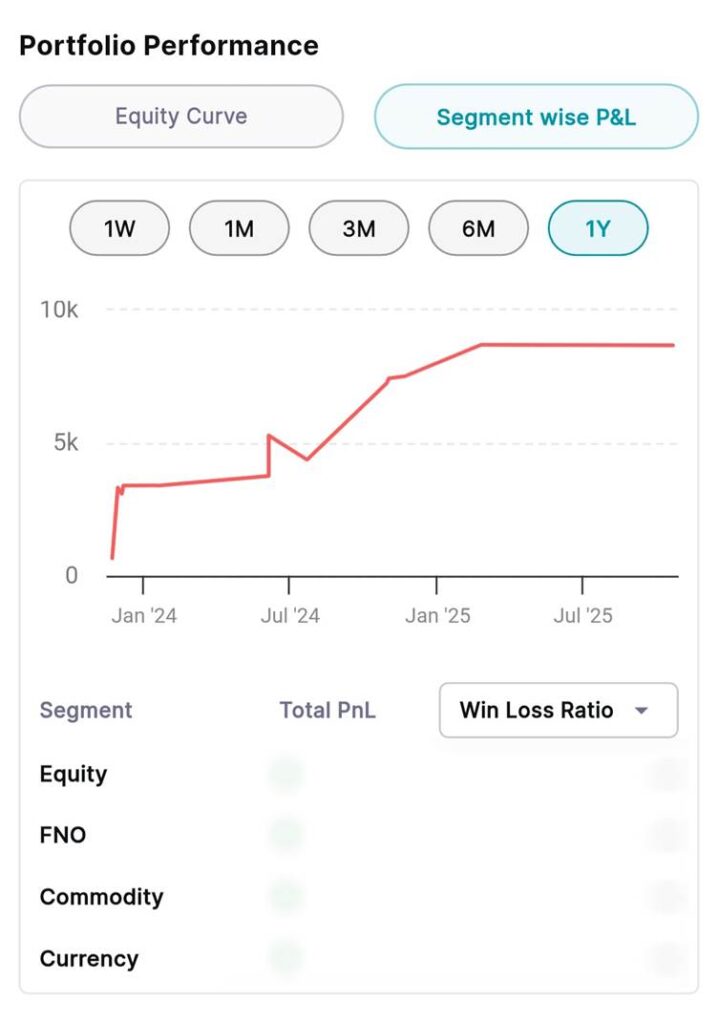
Want to know how your portfolio has done over time?
Equity Curve – a graph that shows how your portfolio has grown over time
Segment-wise P&L – to find out which market segment (Equity, F&O, Currency) is making the most money
You don’t have to guess what went right or wrong anymore; you have data to back it up.
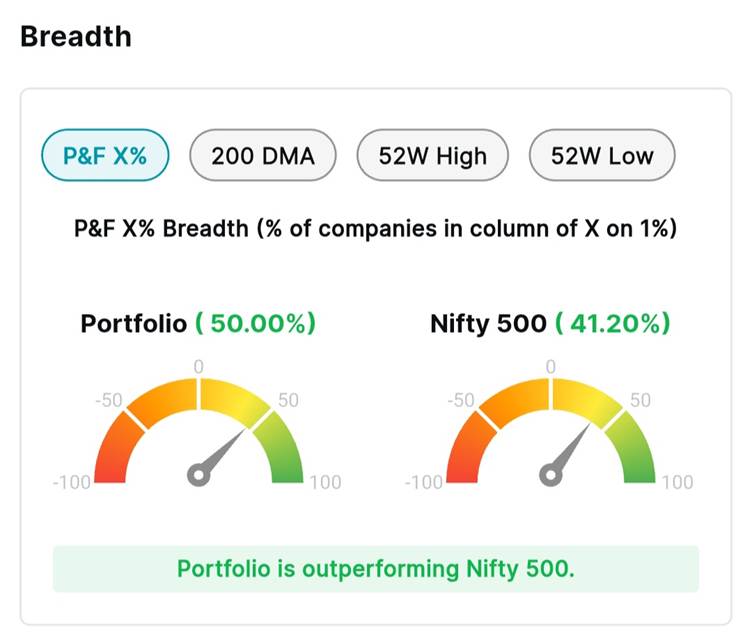
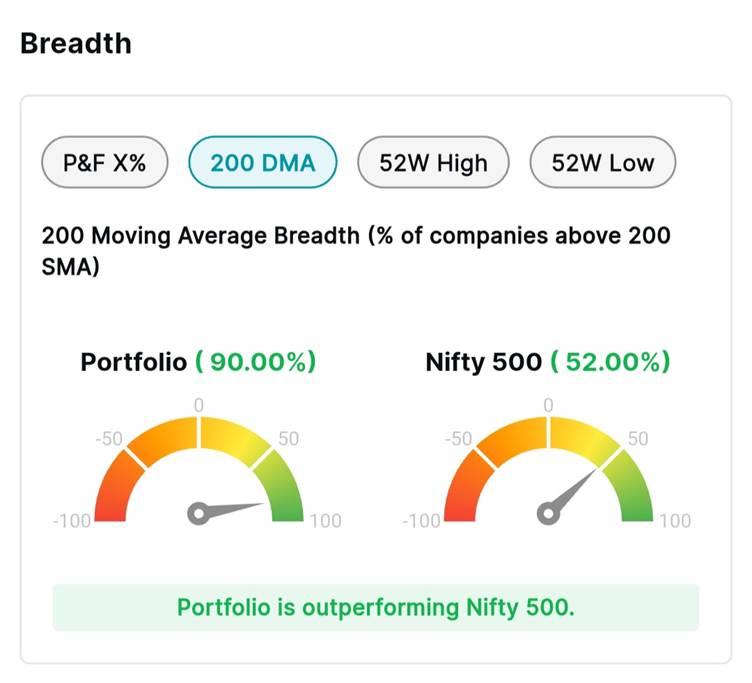
6. Portfolio vs. Market Breadth: Compare Yourself to the Index
This is one of the most powerful but least talked about parts. When you compare your portfolio to major benchmarks like the Nifty50, you can see if your investments are doing better or worse than the market.
The breadth metrics are:
P&F X% Breadth
200 DMA Width
52-Week High-Low Range
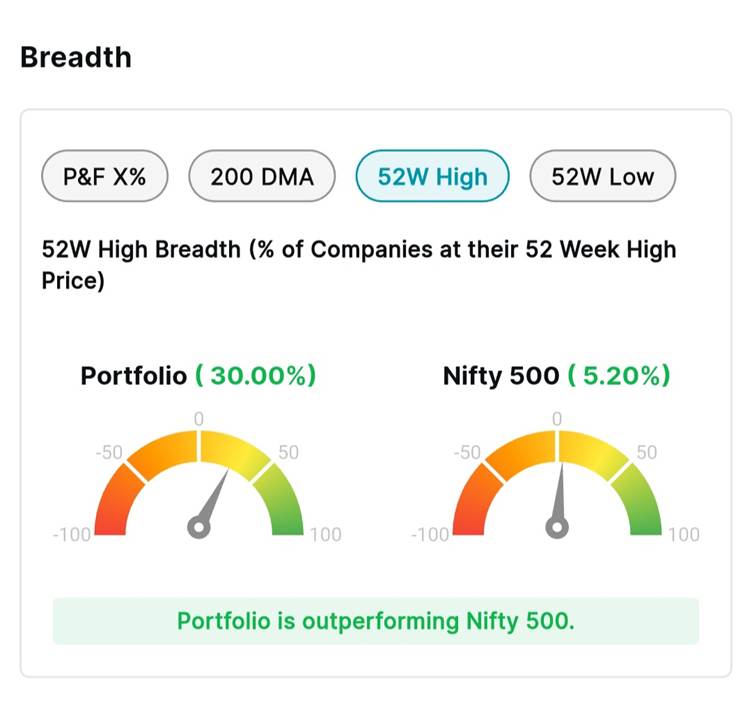
You don’t just know how well your portfolio is doing; you also know why.
These insights help you make decisions on time instead of too late.
7. Your monthly story in red and green is the P&L Calendar.
The P&L Calendar is an emotional dashboard that shows every trader’s journey.
It shows:
- Days of Profit
- Days of Loss
- Trends in performance
- The days of the week when you trade best
This is a wake-up call for disciplined traders who want to know more about their behaviour than just their numbers.
Keeping Track of Your Portfolio Doesn’t Have to Be Hard
Investors have to deal with alerts, tips, indicators, and advice, a structured portfolio analysis tool is no longer an option; it is a must.
Zone Mobile brings everything together under one roof:
- Fundamental snapshot
- Technical strength
- Sector & marketcap insights
- Market breadth
- Performance analytics
- Behavioural patterns
Your portfolio should help you, not stress you out. And with Zone Mobile, it’s no longer a hassle to keep track of your investments. It becomes a habit, and soon it becomes an advantage.