Published on: November 28, 2025
If you have ever tried exploring mutual funds as an investment option, you already know the confusion that comes with it.
India has over 3,000 listed companies on the National Stock Exchange (NSE) and the Bombay Stock Exchange (BSE). But when it comes to mutual funds, the number of schemes is even bigger. In fact, there are over 5,000 mutual fund schemes in India today.
So if an investor wants to choose “the right” mutual fund, where should they even begin?
Why Choosing a Mutual Fund Is Not Just About Returns
Most new investors look at returns first. If a fund has given high returns in the past, the instinct is to invest immediately. But mutual fund investing depends on multiple factors:
- Your risk appetite
- Your investment horizon
- The category of fund you choose
- The size of the fund (AUM)
- The portfolio composition
- Your financial goals
For example, if you want to invest for just one year, a small-cap fund may not be suitable because of higher volatility. But if you are investing for 15–20 years, the picture changes completely.
This is where MF Zone steps in to help investors filter funds based on what matters to them.
A Walkthrough of MF Zone: What You Can Do Inside
The MF Zone platform begins by showing top-performing schemes across various categories like ELSS, Flexi Cap, Mid Cap, etc. based on different timeframes like 1-year, 3-year, or since inception. Past performance is not a recommendation, but it is a useful starting point.
Clicking on any scheme opens a detailed overview page, which includes:
- NAV History
A full chart of how the fund’s NAV has moved over time.
- Scheme Details
- Fund type
- Fund manager
- Minimum investment
- AUM (Assets Under Management)
- Risk category
- Investment strategy
For example, a scheme managing ₹4,000 crore naturally behaves differently from one managing ₹1,20,000 crore.
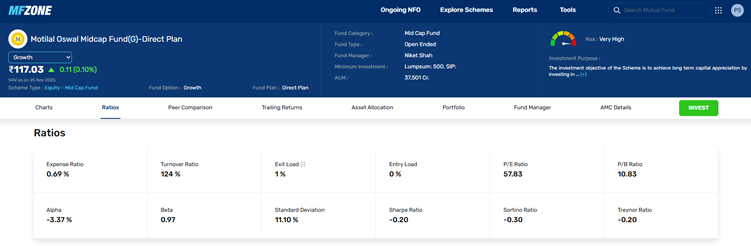
- Ratios Tab
For deeper analysis, MF Zone shows important risk-adjusted metrics:
- Sharpe Ratio
- Sortino Ratio
- Treynor Ratio
- Standard Deviation
- Exit load
- Turnover ratio
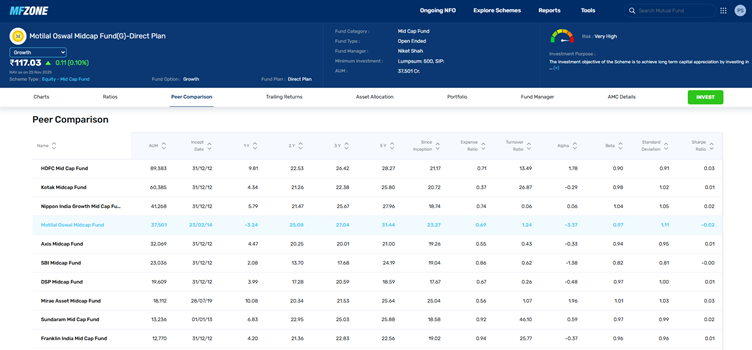
- Peer Comparison
This is one of the most powerful sections. Here, you can compare:
- Returns (1-year, 3-year, 5-year)
- AUM
- Expense ratios
- Turnover
- Alpha, Beta, and more
You can sort the list to find:
- Lowest expense ratio
- Highest alpha generators
- Funds with lowest churn
- Funds with better risk-adjusted performance
It becomes very easy to see which funds truly stand out among their competitors.
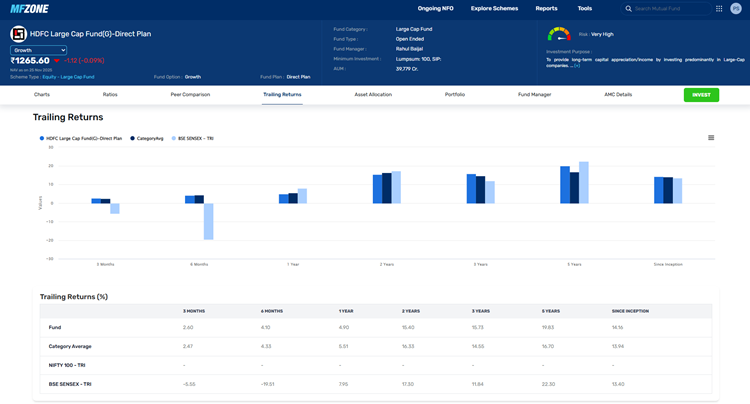
- Trailing Returns
This section is very useful. You can see how the scheme has performed in the past and compare its returns with the benchmark and the Category Average.
You can also check returns for 3 months, 6 months, 1 year, 2 years, 3 years, 5 years, and since inception.
- Asset Allocation and Portfolio Insights
MF Zone also breaks down each fund’s actual investments:
- Large-cap, mid-cap, small-cap split
- Domestic vs international allocation
- Cash levels
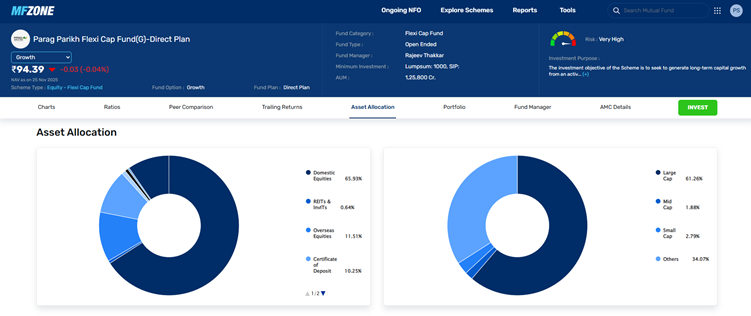
For example, Parag Parikh Flexi Cap shows both domestic and overseas equity exposure, which gives investors clarity about its global diversification.
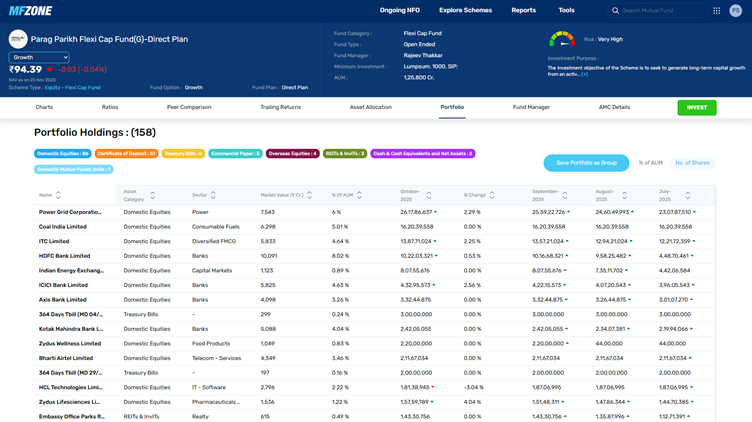
- Portfolio Tab is extremely helpful because it shows:
- All the companies the fund holds
- Data for the last four months
- Where buying or selling has happened recently
You can see which stocks are being accumulated or reduced—an invaluable insight for long-term investors.
MF Scanner: The Power to Filter Funds Your Way
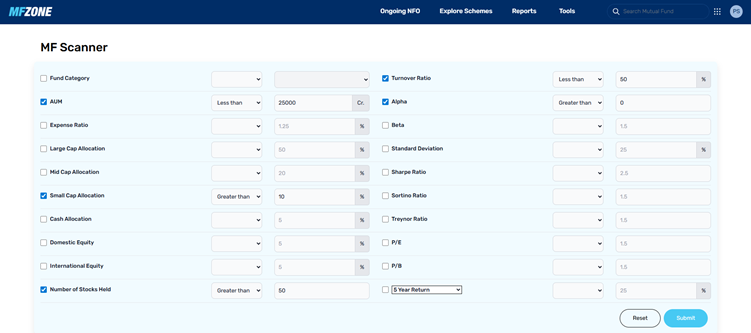
The Mutual Fund Scanner in MF Zone is designed for investors who have specific requirements.
Want funds with:
- AUM less than ₹25,000 crore?
- Small-cap allocation greater than 10%?
- Turnover ratio below 50?
- More than 50 stocks?
- A certain level of alpha or beta?
Just select your parameters and the scanner instantly shows only the funds that match.
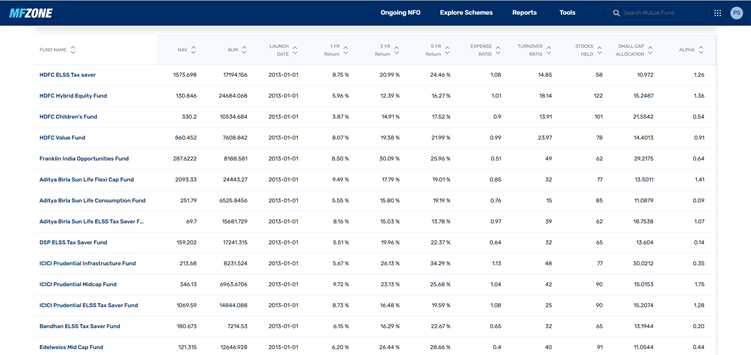
This level of customisation is rare and extremely helpful for serious investors.
Explore Schemes: For Category-Based Selection
If you want to explore funds category-wise (like Mid Cap, Flexi Cap, ELSS, etc.), MF Zone lists them clearly. You can then sort by:
- AUM
- Expense ratio
- Returns
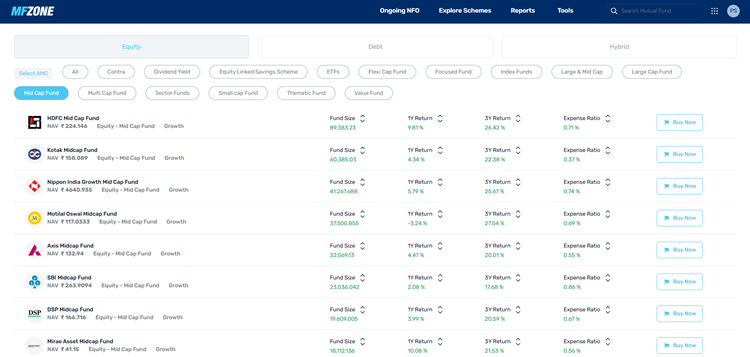
For example, within Mid Cap Funds:
- HDFC Midcap Opportunities manages ₹89,383 crore
- Kotak Midcap has an expense ratio of just 0.37%
- Smaller funds appear below if you sort by AUM
This helps investors see the entire landscape in one place.
Are You Actually Diversified? Portfolio Overlap Will Tell You
One of the most exciting tools is Scheme Portfolio Overlap.
Many investors buy 2–3 funds from the same category thinking they are diversifying. But if those funds hold the same stocks, you are not diversified; you are simply paying extra expense ratios.
For example:
- Two large-cap funds might have 58% portfolio overlap
- But a large-cap fund and a mid-cap fund might have only 6% overlap
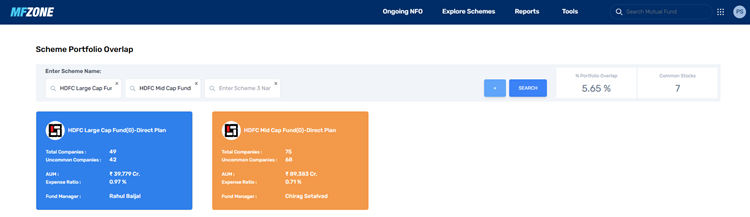
The tool shows:
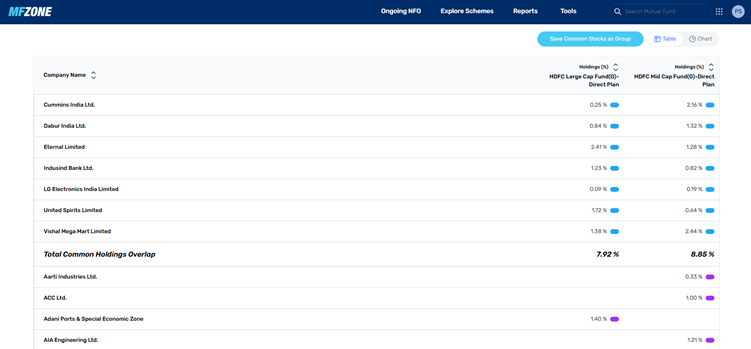
- Number of common stocks
- Percentage overlap
- Stock-by-stock comparison with weightages
Every existing MF investor must check this at least once.
NFO Section: Track New Fund Offerings
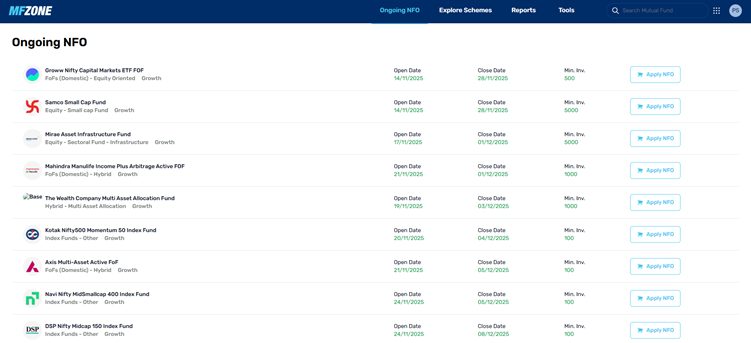
Just like IPOs, mutual funds launch NFOs. MF Zone lists:
- Open date
- Close date
This helps investors track upcoming opportunities without hunting across websites.
Analyse before Investing in MF
MF Zone by Definedge is not just a mutual fund directory, it is a complete research and decision-making platform. Whether you are starting your investment journey or already have multiple funds, MF Zone helps you:
- Understand schemes deeply
- Compare funds intelligently
- Avoid duplication
- Filter schemes based on your goals
- Track NFOs
- Analyse risk and returns properly
Most importantly, it helps you become a more confident and informed investor.
If you haven’t explored your mutual fund portfolio through the lens of overlaps, ratios, and allocations yet, now is the right time. A small amount of knowledge can save years of confusion.