Published on: February 17, 2026

Markets leave clues. Not in headlines. Not in opinions. But in technical chart structure.
A fractal in trading is a repeating price structure — either across timeframes or across different stocks. When two companies from the same sector begin to form similar bases, similar rounding patterns, and similar accumulation behaviour, it is not random. It is sectoral capital at work.
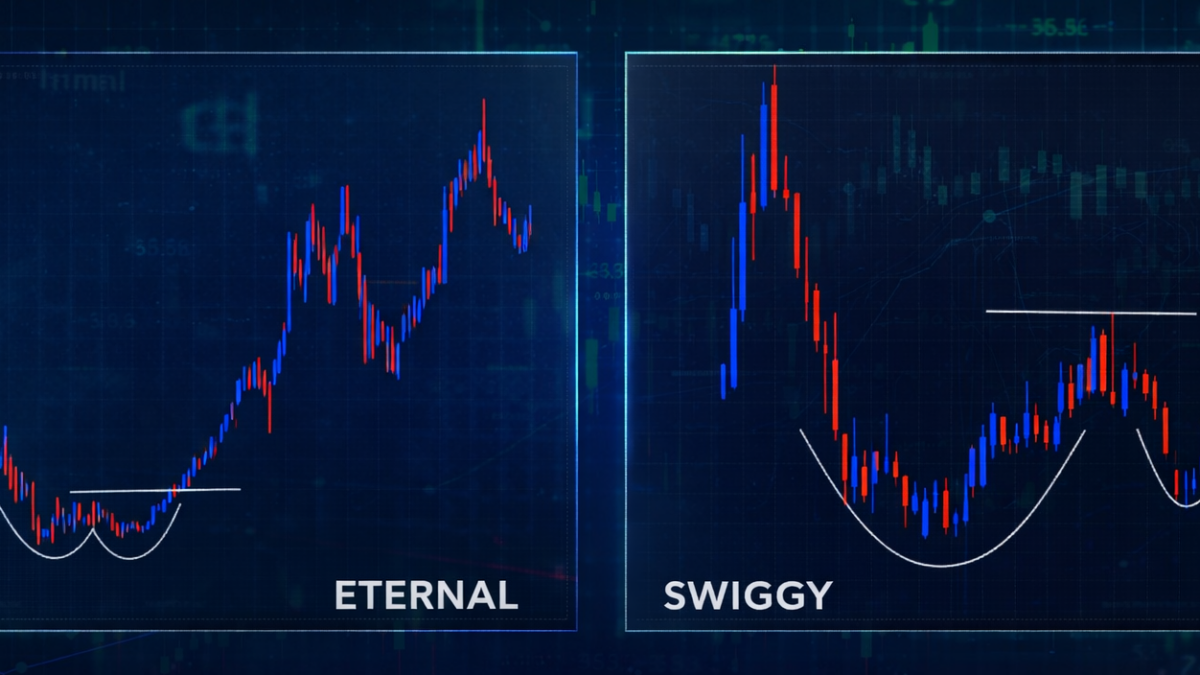
Let us look at a live example — Eternal and Swiggy.
On the weekly chart of Eternal, after a prolonged decline, the stock formed a rounded bottom structure. The selling pressure gradually dried up. Volatility started contracting. The lows stopped expanding downward. Instead, the price began forming higher lows near the base. Eventually, the stock reclaimed the neckline zone and transitioned into a powerful multi-quarter uptrend.
Now shift your attention to Swiggy’s weekly structure.
After a steep post-listing correction, Swiggy also carved out a deep rounded base. The price oscillated within a broad bowl-like structure. There was visible volatility compression near the lower band. Recently, the stock has started forming a minor higher low attempt on the right side of the structure — almost like the early phase Eternal went through before its breakout.
This is a sectoral fractal.
The shapes are not perfectly identical — fractals never are. But the psychology is similar:
- Sharp decline
- Sentiment washout
- Slow accumulation
- Rounded base formation
- Volatility contraction
- Attempt to reclaim resistance
When you see this happening in two companies operating in the same new-age consumption space, it tells you something important — the sector itself may be stabilising.
What This Teaches Us
1. Capital Rotates in Themes
Institutional money rarely buys only one stock. If confidence builds in a sector, allocation spreads across leaders and potential challengers. Eternal’s earlier breakout could be interpreted as early sector leadership. Swiggy may now be attempting to follow the same structural roadmap.
This is how sectoral momentum builds — first one chart improves, then the second starts echoing the structure.
2. Fractals Improve Conviction
If Eternal had formed a rounded base in isolation, it would still be tradable. But when Swiggy shows a comparable long-term bowl structure, it increases the probability that this is not stock-specific — it is sectoral.
That improves conviction. It reduces randomness.
3. Timing Will Differ
Eternal completed its base and delivered its rally. Swiggy is still in the right-hand side development phase. Fractals do not demand identical timing. They demand similar structure and psychology.
One may lead. The other may lag. The opportunity often lies in recognising the laggard before the breakout.
4. Failure Is Also Informative
If Swiggy fails to sustain higher lows and breaks below its rounded structure support, it would weaken the sectoral fractal thesis. Structure first. Narrative later.
The Deeper Insight
Fractals remind us that charts reflect behaviour. When two companies in the same sector begin to trace similar accumulation patterns, it suggests:
- Selling pressure is exhausted
- Long-term participants are absorbing supply
- Risk appetite toward the sector is gradually improving
As traders and investors, our job is not to predict earnings or media narratives. Our job is to read structure.
Right now, Eternal represents a completed fractal — base to breakout to trend. Swiggy appears to be in the process of potentially completing its own rounded accumulation.
Whether it confirms or fails will depend on how price behaves near resistance and how higher lows evolve.
But the lesson is powerful:
Do not study charts in isolation.
Study sectors.
Study peer structures.
When patterns begin to echo within the same space, the market is telling you something.
And those who listen early often participate early.
Open the App, not Zomato or Swiggy, but the Zone Mobile and start ordering your investments.