


Published on: January 16, 2026

Mutual fund investments are subject to market risks. Please read all scheme-related documents carefully before investing.
Does choosing a mutual fund feel confusing to you? Or are you a “look at returns” investor? The ones who compare one‑year, three‑year, and five‑year numbers pick the top performer and move on. Yes, that can feel rational and safe. And yet, over long periods, it often fails.
Because a mutual fund is not a stock tip. It is a process, run by a fund manager, expressed through a portfolio, and revealed through behavior, not headlines of whose returns top momentarily.
Let us slow this down and look at how good mutual funds are actually identified.
Why Past Returns Don’t Tell the Full Story
History gives us a clear lesson. Funds that sit at the top of performance tables rarely stay there.
In one real example, a scheme ranked number one in 2017 slipped to 165th by 2020. That means over the next three years, it delivered lower returns than 164 other funds. Anyone who invested purely because it looked “best” in 2017 paid the price for that assumption.
Markets rotate. Styles fall in and out of favor. What worked recently may stop working quietly. So instead of asking “Which fund performed best?”, a better question is:
“How does this fund behave?”
Think of Ratios as a Fund’s Behavior Report
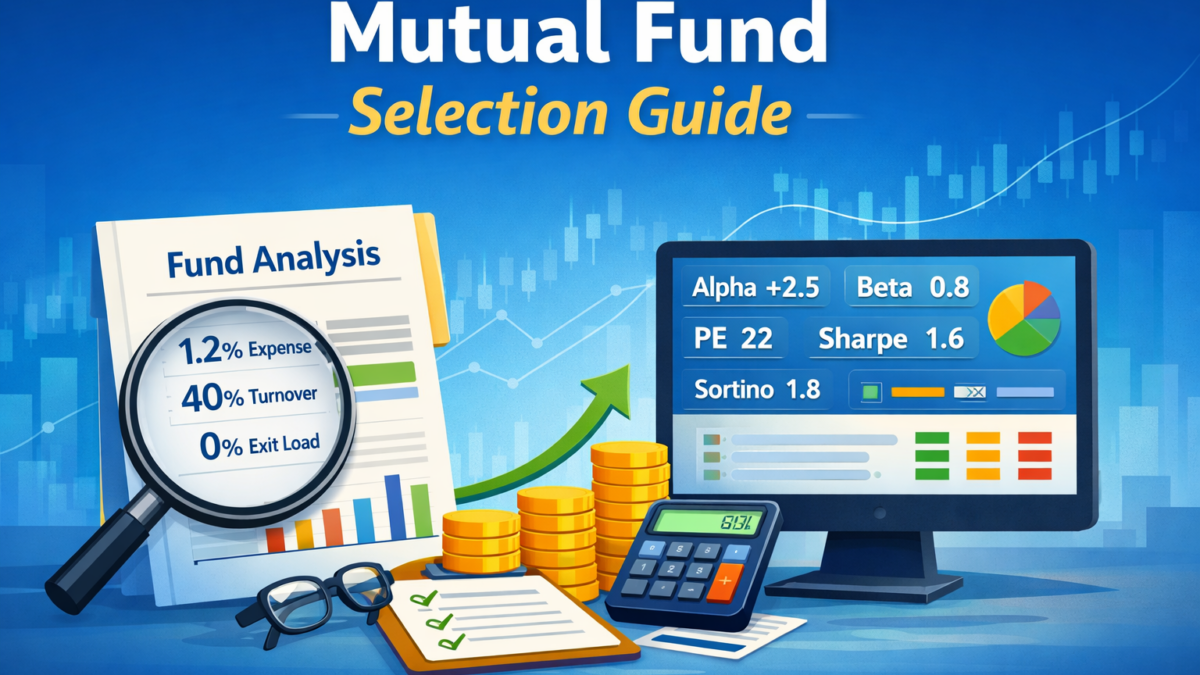
Every mutual fund carries a set of ratios that quietly describe how it is run. Together, they act like a health report, showing cost discipline, risk appetite, portfolio stability, and manager skill.
Once you learn to read these numbers, fund selection becomes far more logical and far less emotional.
Step 1: Start with Costs and Discipline
Expense Ratio
The expense ratio is the annual fee you pay the fund house to manage your money. It may look small, but over long periods, it compounds, just like returns.
As a broad comfort zone:
- Regular equity plans usually sit around 1-1.5%
- Direct plans are healthier when they stay between 0.5-1%
Lower costs don’t guarantee better returns, but high costs quietly reduce them.
Turnover Ratio
Turnover ratio shows how frequently the fund manager changes stocks.
A portfolio that changes too often tends to incur higher costs and reflects short‑term thinking. A reasonable churn suggests patience and conviction.
For most diversified Indian equity funds, 20–60% turnover signals balance. Much higher than that often indicates unnecessary activity.
Step 2: Understand What You are Paying For
PE and PB Ratios
These ratios tell you whether the portfolio is reasonably valued.
- PE ratio shows how expensive the holdings are relative to earnings
- PB ratio compares market price to underlying book value
For Indian equity funds, PE values often fall in the high‑teens to mid‑twenties, while PB ratios commonly sit between 2 and 4. Extremely high numbers don’t mean “bad”, but they do mean expectations are already high and that matters during market corrections.
Step 3: Separate Skill from Market Movement
Alpha
Alpha answers a simple question: Did the fund manager actually add value?
A positive alpha means the fund outperformed its benchmark. Sustained alpha, usually in the 1 to 4 range, indicates skill rather than luck.
Beta and Standard Deviation
Beta shows how closely a fund moves with the market. Standard deviation shows how volatile returns are.
Funds with beta below 1 and controlled volatility tend to feel calmer during market stress. They may not top return charts every year, but they often protect capital better when markets turn rough.
Step 4: Look at Returns Through the Lens of Risk
This is where risk‑adjusted ratios matter.
Sharpe Ratio:The Sharpe ratio answers a simple but important question: Were the returns worth the volatility?
It measures how much extra return a fund generates over a risk-free investment, after adjusting for total risk (price fluctuations both up and down).
- Higher is better
- Above 0.5 indicates reasonable risk-adjusted performance
- Above 1 is considered strong and efficient
A good Sharpe ratio suggests the fund is being compensated well for the volatility it carries.
Sortino Ratio:The Sortino ratio takes the Sharpe concept one step further.
Instead of penalizing all volatility, it focuses only on downside risk, how the fund behaves during market declines. This makes it especially useful for investors who care more about protection during falls than participation during rallies.
- Higher values are better
- Above 0.7 suggests the fund manages downside risk reasonably well
A strong Sortino ratio often reflects steadier behavior when markets turn volatile.
Treynor Ratio:The Treynor ratio looks specifically at market risk.
It measures how much excess return a fund earns over the risk-free rate for each unit of market-related risk (beta) it takes. In simple terms, it tells you how efficiently the fund uses exposure to the market.
- Many Indian equity funds fall between 0.05 and 0.20
- Higher values indicate better returns for the level of market risk assumed
Higher values across these three ratios suggest efficiency, not just performance. Funds that score well here often feel smoother to stay invested in.
Step 5: Match the Fund to Yourself
Once quality filters are applied, personal preference matters.
Some investors are comfortable with mid‑cap and small‑cap exposure. Others sleep better, knowing most of their money sits in large, stable businesses. Neither is right or wrong, what matters is alignment.
A good fund is not one that looks impressive on paper, but one you can stay invested in through cycles.
Final Thought
The best mutual fund is rarely the loudest one. It is usually consistent, reasonably priced, risk‑aware, and quietly disciplined.
When you move beyond past returns and start reading a fund’s behavior through ratios, investing becomes less reactive and more intentional.
That shift, from chasing performance to understanding processes, is what builds long‑term outcomes.
Where can you analyze all of this easily?
You don’t have to calculate or track these ratios manually.
You can access all these mutual fund analytics, ratios, scanners, and filters on MFZone by Definedge
To stay connected and updated with more such educational, data-driven content:
Consistent learning is the most underrated edge in long-term investing.
