Customer Support : 020-61923200, [email protected] | Call and Trade : 020-61923220

Uncommon Patterns Combo Strategy
Uncommon Patterns Combo Strategy
Strategy Type: Intraday
Direction: Bullish
Instruments: Cash, ETF, Options
You can select the instrument type and exchange. This is a pattern-based Algo and is applicable across all instruments. You can define your own group, apply filters, decide the investment amount or quantity, and customise it as per your preference.
There are certain price pattern setups that occur less frequently, but are highly logical and powerful, offering strong opportunities to participate in meaningful moves.
Below is a brief explanation of three such patterns.
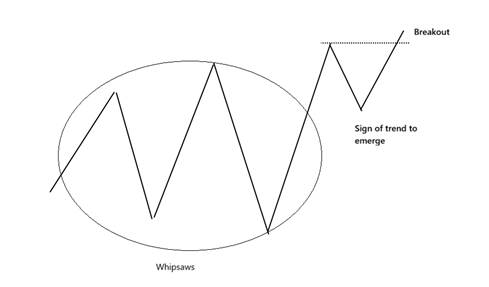
1. Broadening follow-through
Price moves through cycles of volatility and trend.
After a series of false breakouts or whipsaws, when price begins to show signs of strength, it often presents a compelling opportunity to align with the emerging trend.
The image below illustrates one such setup, known as a broadening follow-through pattern.
2. Bullish Catapult
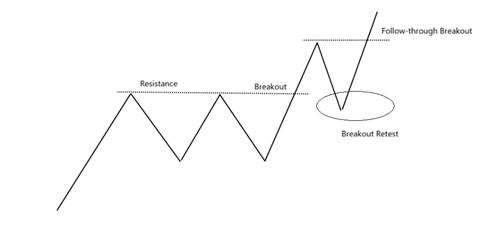
Price breaks out above a strong resistance, attracting breakout traders into the move.
However, the price soon falls back below the breakout level, creating doubt about the pattern.
Confidence among bulls weakens, and many participants begin to exit their positions.
Then comes the shift.
Price turns bullish again and moves sharply higher—within the same swing—breaking above the previous high.
This sequence traps weak hands and re-establishes strength in the trend.
This rare yet powerful setup is known as the Bullish Catapult pattern in noiseless Point & Figure charts.
3. Multi-column Engulfing pattern:
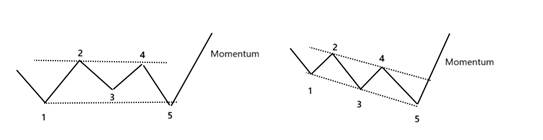
When the length of swing moves starts reducing, it indicates significant price contraction.
Remember, we are not referring to individual candles, which represent price movement over a fixed time period. We are referring to swing moves, which capture the true structure of price action.
In candlestick charts, when the range of the current candle engulfs the range of several prior narrow candles (for example, the last five), we call it as a multi-engulfing pattern.
Similarly, in Point & Figure charts, when a series of narrow swing moves is followed by a strong expansion, it is referred to as a Multi-Column Engulfing pattern.
The above patterns are effective, though they do not occur frequently. However, whenever they do, they offer meaningful trading opportunities.
A combination of these three patterns can be used to design an algorithmic trading setup based on such uncommon formations.
Strategy Details:
- Strategy Name: Uncommon Patterns Combo Strategy
- Universe: F&O Stocks (Cash segment)
- Action: Long
- Type: Intraday
- Max Open Position: 2
- Max Trades in a day: 5
- Max Day loss limit: 10,000 (User-preference and depending upon quantity)
- Square off time: 3.10 pm
- Box-size: 0.15% x 3 (High-low chart)
- Timeframe: 1-min
- Entry Condition: Uncommon Patterns Combo Strategy
- Exit Condition: Bearish Swing breakout (Double bottom sell)
- Market Trend Filter: Nifty intraday trend should be bullish. Nifty (0.05% x 3) above 10-SMA on one-min timeframe
Market Trend Filter
An intraday market trend filter is one of the most effective ways to improve strategy performance.
Even a strong bullish breakout strategy can struggle on days with a weak or sideways trend.
This often leads to failed breakouts and higher drawdowns.
To address this, trades can be aligned with the broader market trend.
- Execute bullish strategies only in an uptrend
- Execute bearish strategies only in a downtrend
We refer to this as the Market Trend Filter.
How It Works
If the Nifty is in a bullish trend, only bullish strategies are executed.
Bullish signals are ignored when the market is not supportive.
If the market turns bearish while holding bullish positions:
- Exit existing trades based on the exit conditions
- Avoid initiating new bullish trades
In this strategy, we have applied MTF on Nifty. The strategy will run only if Nifty is bullish.
This defines a bullish market condition.
You may use any alternative method—different charting techniques, indicators, or rules—to define market direction.
The same concept can also be applied using other indices or instruments, not just Nifty.
Filters
You can further enhance the strategy by adding filters: additional rules, indicators, or pattern-based conditions.
One effective approach is to incorporate a higher timeframe trend filter, such as the daily trend of the stock.
You can also apply intraday-specific filters to improve trade quality.
You can also modify the Max Open and Max Trades parameters. Increasing these values will result in a higher average number of trades. Change the max day loss figure accordingly.
The universe considered here is the F&O segment, as an example. You can apply this strategy in cash segment as well.
This strategy can be applied across stocks, futures, options, ETFs, and commodities—whether trading a single instrument or a group of stocks.
You can identify the pattern and trade the underlying instrument such as stocks, futures, ETFs, or commodities. Alternatively, you may trade options based on signals from the underlying.
For example, when the pattern is confirmed in the underlying, you may choose to trade the corresponding ATM call option.
You can also identify and trade patterns directly on options charts, wherever applicable.
This is a simple yet effective consolidation breakout strategy.
With the right filters, you can further refine and personalise it to suit your trading style.
You can modify it, test it, and deploy it on the Algostra.