Customer Support : 020-61923200, [email protected] | Call and Trade : 020-61923220

Affordable Breakout Strategy Bearish
Affordable Breakout Strategy Bearish
Strategy Type: Positional
Direction: Bearish
Instruments: Futures, Cash, ETF, Options
You can select the instrument type and exchange. This is a pattern-based Algo and is applicable across all instruments. You can define your own group, apply filters, decide the investment amount or quantity, and customise it as per your preference.
Swing Breakout Strategy Using Price Action and P&F
Concept Overview
The swing breakout strategy is a simple yet powerful trading approach based on price structure. It relies on identifying key swing highs and swing lows and trading breakouts from these levels.
- A bullish breakout occurs when price moves above a previous swing high.
- A bearish breakout occurs when price falls below a previous swing low.
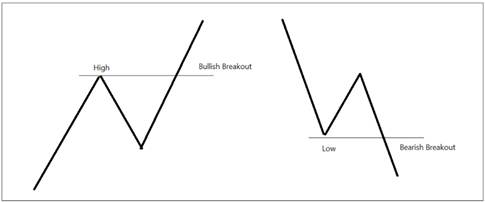
This method works across timeframes and can be enhanced using Point & Figure (P&F) charts to make the setup more objective and rule-based.
Basic Price Action Rules
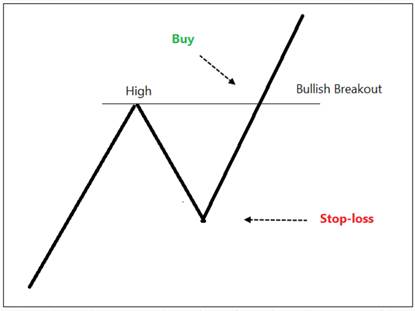
Bullish Setup
- Identify a clear swing high and swing low.
- Wait for price to break above the previous swing high.
- Enter a buy trade on the breakout.
- Place stop-loss below the previous swing low.
Bearish Setup
- Identify a clear swing low and swing high.
- Wait for price to break below the previous swing low.
- Enter a sell trade on the breakout.
- Place stop-loss above the previous swing high.
Key idea:
The previous swing point becomes your risk level (stop-loss).
Role of Point & Figure (P&F) Charts
P&F charts remove noise and make breakout patterns more objective by focusing only on price movement.
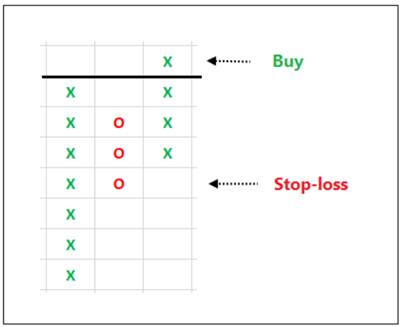
- X column = rising prices
- O column = falling prices
Using P&F, we can:
- Clearly define breakouts
- Quantify risk in terms of “boxes”
- Standardize trade selection
P&F Breakout Strategy Rules
Entry Criteria (Bullish)
- A double-top breakout (price exceeds previous column high).
- This confirms a bullish swing breakout.
Entry Criteria (Bearish)
- A double-bottom breakdown (price falls below previous column low).
- This confirms a bearish swing breakout.
Risk Management Using Boxes
In P&F charts, risk is measured by counting boxes:
- The stop-loss column defines your risk.
- Count the number of boxes in the retracement column (O column for bullish trades).
Affordable Breakout
To ensure high-probability trades:
- Risk Filter
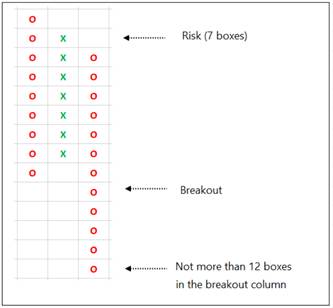
- Maximum 7 boxes in the stop-loss column.
- Post-Breakout Extension Filter
- Price should not have moved more than 5 boxes after breakout.
- This avoids chasing overextended moves.
- Breakout Column Limit
- Total boxes in breakout column should generally not exceed ~12 boxes
(derived from 7 risk boxes + 5 extension boxes).
- Total boxes in breakout column should generally not exceed ~12 boxes
This strategy is often referred to as an:
- Affordable Bullish Breakout
- Affordable Bearish Breakout
Because:
- Risk is capped (≤ 7 boxes)
- Entry is not overextended (≤ 5 boxes after breakout)
This ensures a favorable risk-to-reward structure.
Affordable Bearish Breakout:
Bearish Entry Criteria:
- Affordable Bearish breakout below 10 column moving average
- Group: All Futures – Near month
- Box-size: 0.25% X 3 Daily
Exit Criteria:
- Double Top Buy
You can adjust parameters depending on:
- Trading style (intraday, swing, positional)
- Risk appetite
Key advantages:
- Clear entry and exit rules
- Defined risk
- Easy to scan and automate
Feel free to experiment with it and refine it to suit your trading style, thereby enhancing both execution and conviction. Backtest before deploy.
Filters
You can further enhance the strategy by adding filters: additional rules, indicators, or pattern-based conditions.
One effective approach is to incorporate a higher timeframe trend filter, such as the daily trend of the stock.
You can also apply intraday-specific filters to improve trade quality.
With the right filters, you can further refine and personalise it to suit your trading style.
You can modify it, test it, and deploy it on the Algostra.