Customer Support : 020-61923200, [email protected] | Call and Trade : 020-61923220
Tweezer Pattern

Developed at Definedge
Prashant Shah introduced the P&F Tweezer pattern in his book Trading the Markets the Point & Figure way.
Tweezer is a horizontal accumulation-distribution pattern made objective via P&F charts.
A follow-up to consolidation between two anchor columns can be explained by this pattern.
See the above image. The P&F Tweezer bullish formation rules are:
- Consolidation between two anchor columns forms the Tweezer pattern
- Second Anchor column should be bullish for the bullish tweezer pattern
- Maximum 6 columns between two anchor columns
- Plot Bullish aggressive horizontal count when a tweezer gets formed
- A column breakout in any of the subsequent columns activates the tweezer and the count
- The bullish pattern gets negated when the bottom of the pattern gets broken
Below are the characteristics of the pattern:
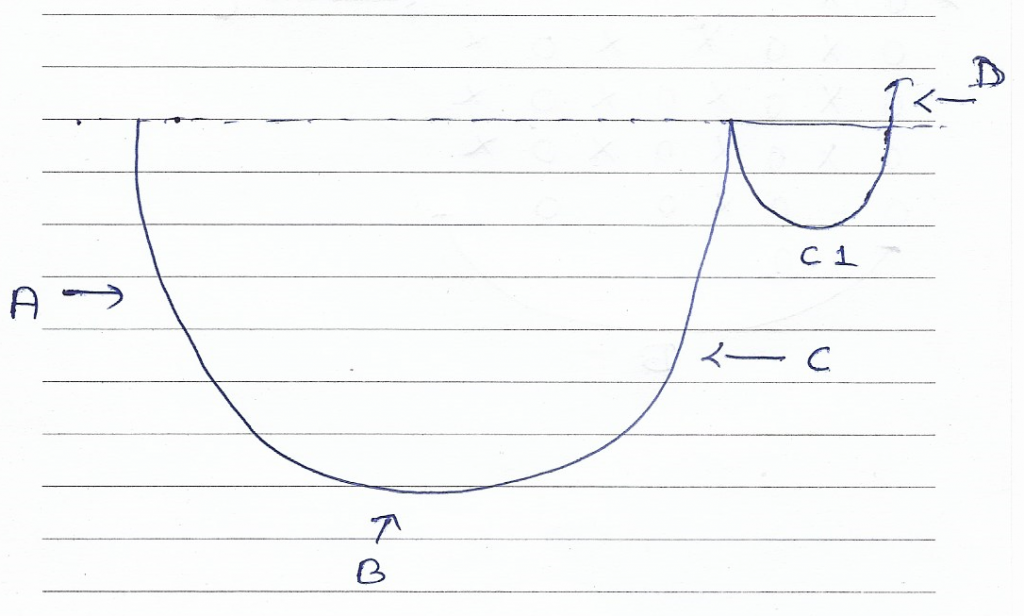
A = Strong fall
B = Base
C = Strong rally
C1 = Small base
D = Breakout
It can be defined on a P&F chart:
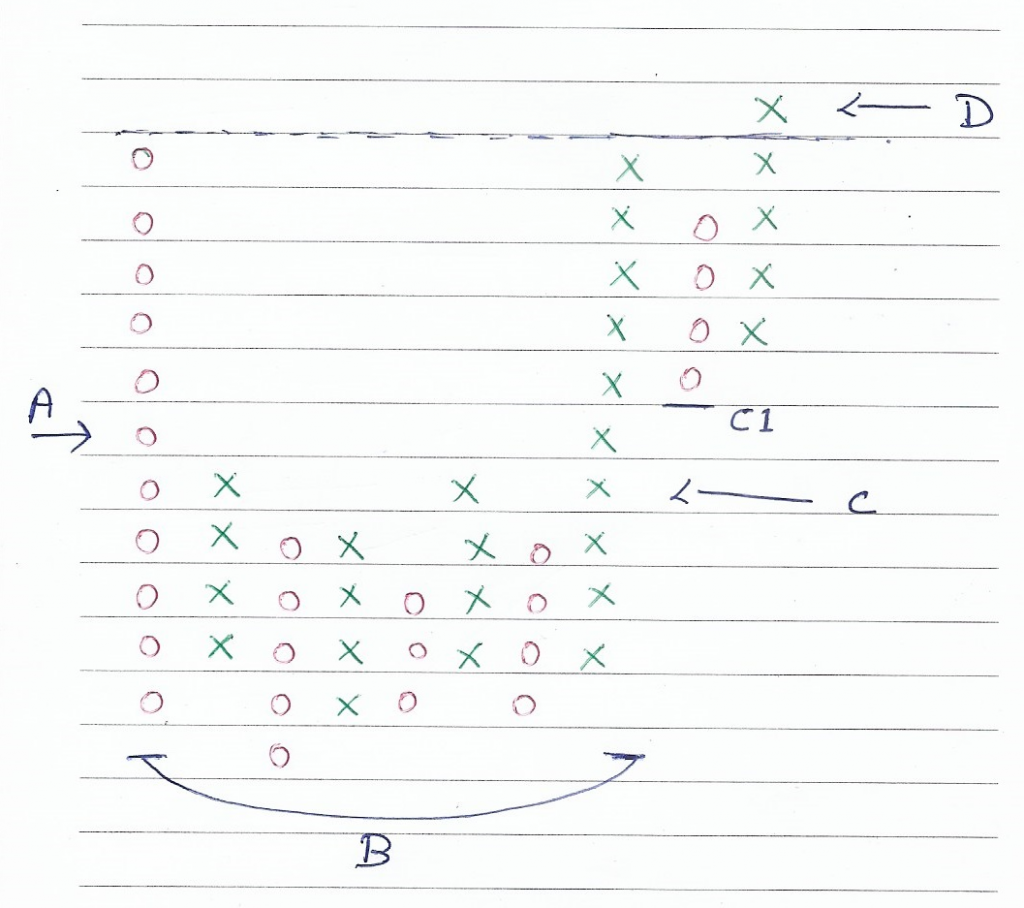
A = Bearish Anchor column
B = Base (I recommend between 2 – 8 columns)
C = Bullish Anchor column C1 = Small base
D = Follow-through DTB
Whenever a Tweezer pattern is identified, it is recommended to plot horizontal aggressive counts on the pattern.
Upon selecting the pattern and plotting from the Zone web, the pattern is plotted along with the horizontal counts.

Click here to learn more about Tweezer pattern.