Published on: December 16, 2025
The fact that the Nifty50 is close to its 52-week high may seem like a good sign. Headlines sound positive, charts look good, and momentum feels strong. But experienced traders know one thing very well: an index can go up even when the rest of the market is slowly getting weaker.
Market breadth is the hidden strength or weakness below the index. When breadth is combined with traditional trend tools like the Golden Cross, it gives a much more accurate picture of how healthy the market is.
Before we get into Golden Cross Breadth, let’s first look at what makes it work.
Golden Cross & Death Cross
Golden Cross is when a short-term moving average crosses (50EMA) above a long-term moving average (200EMA), that’s called a Golden Cross. It is a sign of a bullish trend..
The Death Cross is the opposite of the Golden Cross. It happens when the 50-day moving average goes below the 200-day moving average.
This crossover shows that short-term weakness is outweighing long-term trend strength. It often happens during long corrections, bear markets, or slowdowns in specific sectors. A Death Cross doesn’t mean prices will drop right away, but it does mean that risk is going up and momentum is going down.
Once more, context is important. It’s not too bad if a few stocks have a Death Cross. A Death Cross that spreads across sectors is a warning sign.
Comprehending Market Breadth
How many stocks are really moving in the market?
The rally becomes weak if the Nifty50 is going up but only a few big stocks are pushing it up.
Strong markets are broad markets, which means that a lot of people are buying and selling stocks, sectors, and market caps.
Breadth helps us look past the index-level optimism and see if the rally has real internal strength or if it’s just for show.
What does “Golden Cross Breadth” mean?
Golden Cross Breadth tells you what percentage of stocks in an index or sector are currently in a Golden Cross structure. This means that their 50 DMA is above their 200 DMA.
This changes a price-based indicator into an insight based on participation.
For example:
- If the Nifty50 is close to its highs but Golden Cross Breadth is low, it means that leadership is narrow.
- If Golden Cross Breadth is growing, it means that more stocks are joining the uptrend, which makes the rally stronger and longer-lasting.
Breadth doesn’t tell you exactly where the tops or bottoms are, but it does tell you how strong the trend’s base is.
Scanning the Golden Cross Breadth Using RZone
RZone makes it easier to analyse breadth in a structured and objective way. This is how to scan Golden Cross Breadth across the main sectors and indices:
1. Sign in to RZone and go to the Breadth Scanner.
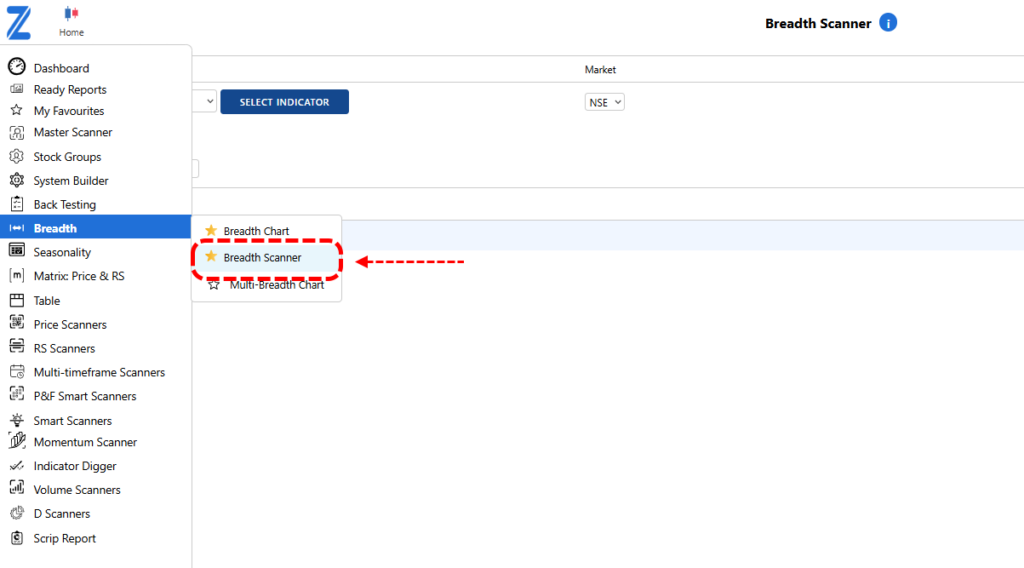
2. Choose “OHLC Indicator Breadth” and then click “Select Indicator and Select Group.”

3. Set the condition that DMA1 is higher than DMA2.
- Set DMA1 to 50
- Set DMA2 to 200
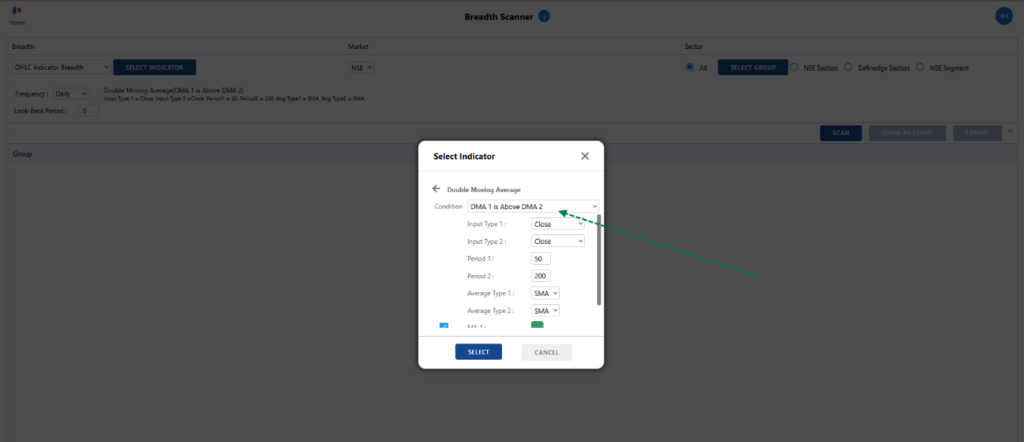
4. Start the scan.
The result shows the breadth percentage of the main indices and segments.
When Nifty100 breadth is 66%, it means that 66 of the 100 stocks in the index are trading in a bullish Golden Cross pattern. This means that a lot of people are taking part in the uptrend, but it could be better.
A breadth above 70–75% is often a sign of strong market-wide momentum.
Checking the Death Cross Breadth for Sectoral Indices
Breadth analysis is just as useful when things go wrong.
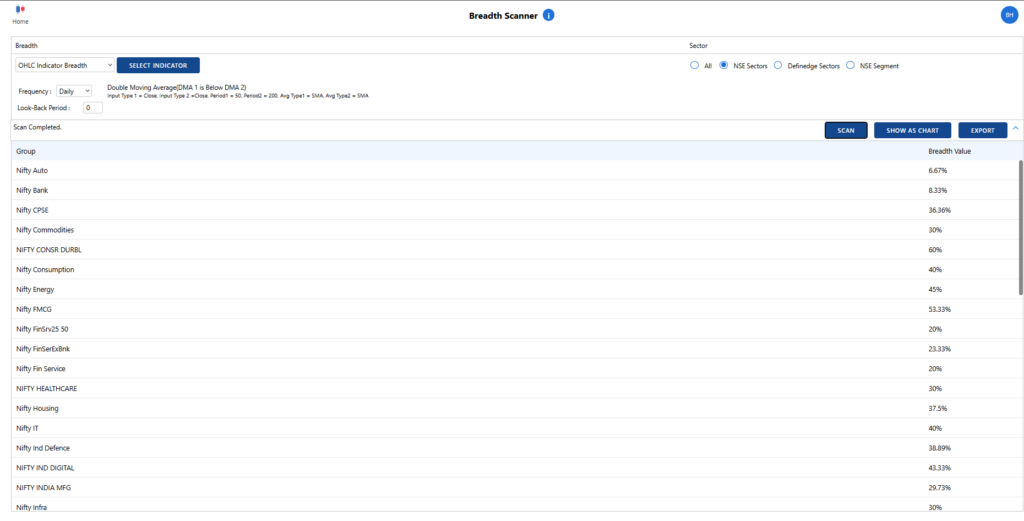
To find sectors that are under pressure, choose DMA1 (50) below DMA2 (200) in the indicator.
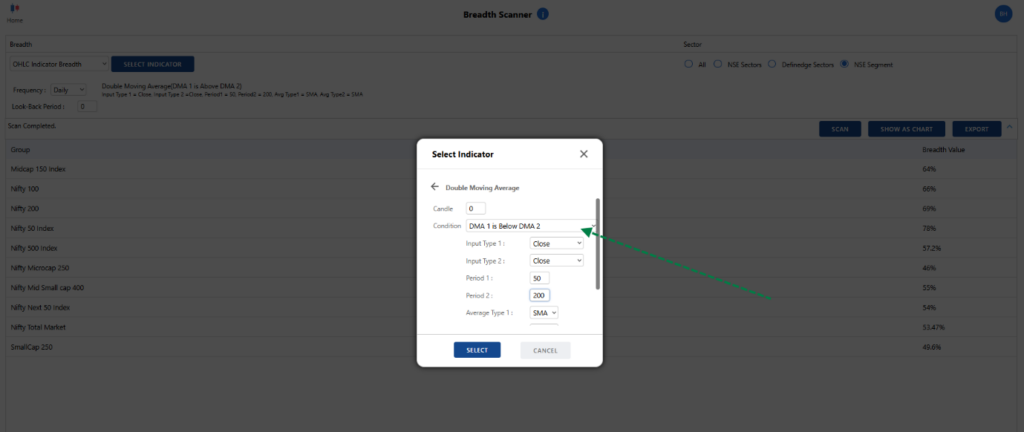
- Pick NSE Sectors as the group.
- Start the scan.
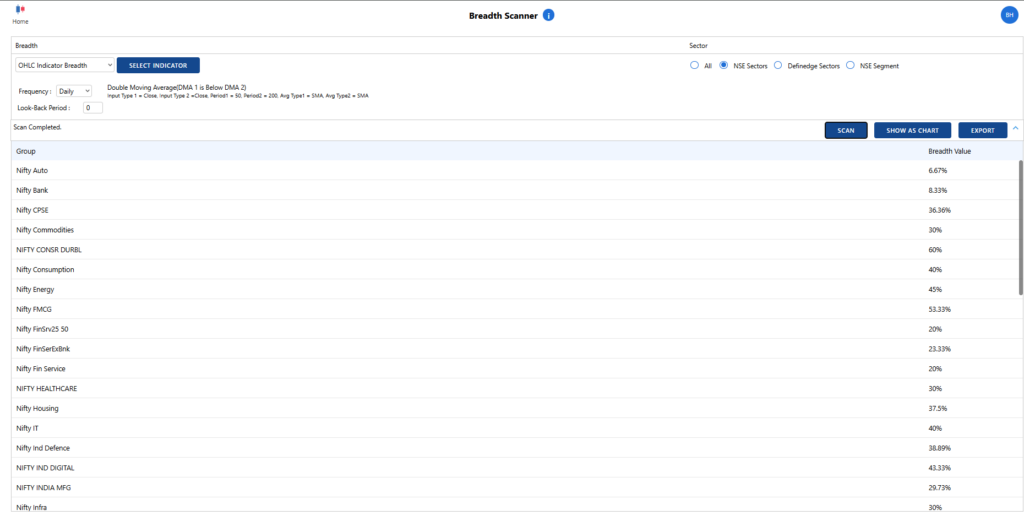
This shows which sectors have a higher percentage of stocks that are in a Death Cross pattern. In a sector, an increase in Death Cross Breadth often comes before a long period of poor performance, even if the overall index looks stable.
Indices can be misleading. Breadth is truthful. Golden Cross Breadth shows you how strong the market is, whether it’s deep or shallow. When price, trend, and participation all point in the same direction, trends last. But be careful when they don’t agree.
In markets, what is hidden is often more important than what is visible.