

Published on: September 30, 2025

Sometimes it feels like analysing a company is like solving a giant puzzle. There are so many pieces-balance sheet numbers, profit and loss statements, cash flow, pledges, dividends, valuations, ratios, the list never seems to end. That is exactly why we developed a simple way to bring all these pieces together in one place: the Perks and Pitfalls Score.
What is the Perks and Pitfalls Score?
The Perks and Pitfalls Score tells you about the overall financial health of a company. Instead of checking dozens of reports and ratios one by one, this score captures almost everything important:
- Quarterly results and yearly financial statements
- Balance sheet strength and cash flow position
- Profitability, solvency, and growth ratios
- Valuations and historical comparisons
- Dividend track record and free cash flow
- Promoter pledges and shareholding changes
- FII/DII activity
- Peer analysis to see how the company stands in its sector
Every time there is an update in the company’s financials, the score also gets updated. So the information you see is always current.
The Three Categories of Companies
To make interpretation easier, companies are grouped into three simple buckets based on their score:
- Aces (Score above 50): These are companies that usually have strong and healthy financials.
- Middlers (Score 25 to 50): These companies are average, i.e. neither too strong nor too weak.
- Gamblers (Score below 25): These companies have weak financial health and carry a higher risk.
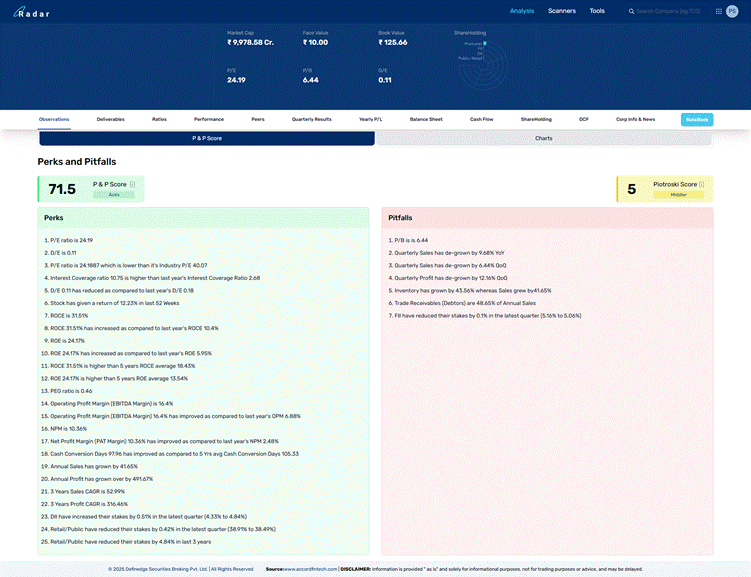
This classification helps investors quickly identify the type of company they are dealing with.
Why this Score Matters
Going through every ratio and financial report is not practical for most investors. The Perks and Pitfalls Score saves time by putting together all the quantitative details into one single number.
How to Use the Perks and Pitfalls Score in Practice
The real power of this score is how easily you can integrate it across platforms. Here is a simple workflow that you can try:
Run a Scanner in Radar
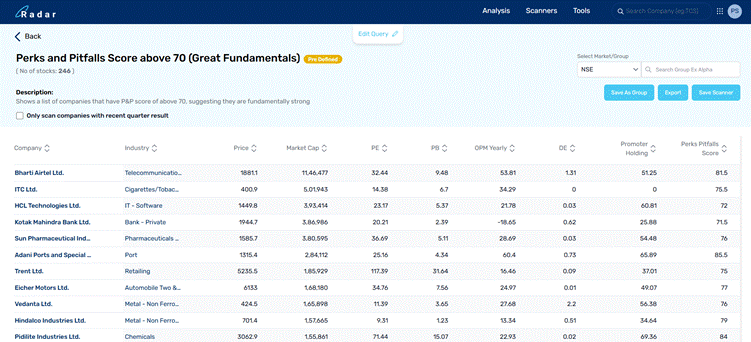
- Create a scanner with the condition: Perks Pitfalls Score > 70
- Suppose this gives you 250 companies.
- Use the “Save as Group” feature to save this list.
Analyse the Group in RZone
- The saved group from Radar can now be used inside Rzone.
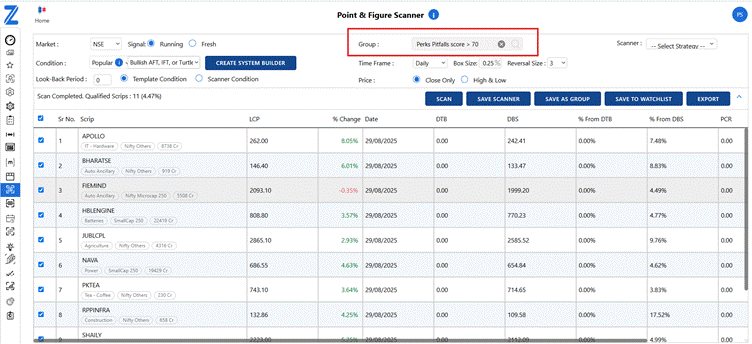
- Here, you can run detailed technical analysis on the same set of companies with tools like:
- Point & Figure scanners
- Renko scanners
- Candlestick scanners
- Matrix and Breadth analysis
- Performance tables
- And all other scanners available in Rzone
This way, you move from Fundamental Strength to Technical Strength without redoing your selection.
Use the Scanner in Momentify
- The same scanner (Perks Pitfalls Score > 70) can be saved and later used in Momentify Investing strategies under the “Radar Fundamentals” section.
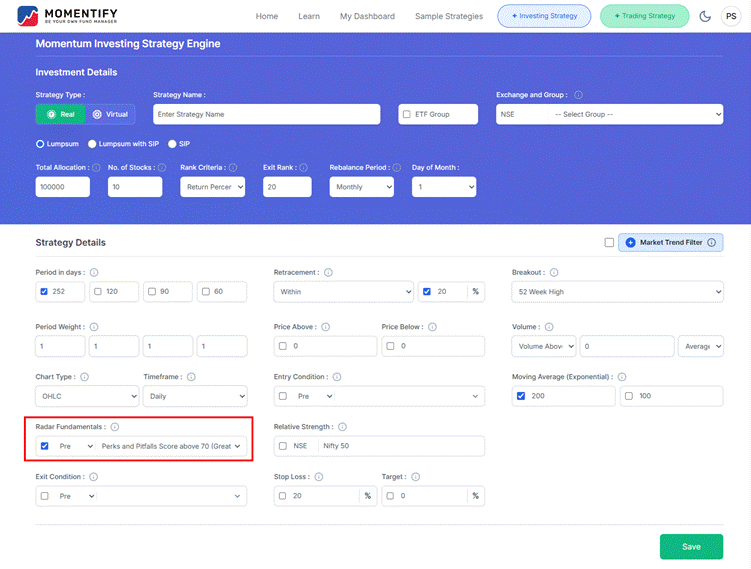
- If you select this scanner while creating a strategy, Momentify will only consider companies that meet your chosen score (for example, a score above 70).
This flow ensures that your investing journey starts with Fundamentally Strong companies and then layers on Technical and Momentum insights.
Conclusion
A single score may look simple, but it can save you from weak companies and help you focus on stronger ones. By combining the Perks and Pitfalls Score with tools across Radar, Rzone, and Momentify, you can establish a clear and consistent process for your investment decisions.
