Published on: January 14, 2026

There was a time when everyone had cable. It was not because it was great, but because that was the default. Then streaming came along. Nothing dramatic happened. The cable didn’t collapse in a year. People didn’t all cancel at once.
They just stopped renewing. One household at a time. One show at a time. And years later, when someone finally looked at the numbers, the change felt obvious.
That’s a useful way to think about copper right now.
Because the most important forces here aren’t the loud ones. They’re the slow changes that build in the background, in supply chains, in policy and even in how things are designed.
So before we get into the drivers, it’s worth stepping back and asking a simple question: why does copper keep refusing to cool off?
Copper hasn’t been loud this year.
But it has been persistent.
Over the last month, prices are up 6.4%.
Over three months, nearly 12%.
Over six months, about 13%.
Zoom out to a year, and copper is up over 40%.
That’s not a short-term spike.
That’s a sustained move.
And by December 2025, copper was already closing in on the $12,000 per metric ton mark, up 35% for the year, heading toward its strongest annual gain since 2009.
So the obvious question isn’t whether copper has moved.
It’s why it’s refusing to cool off.
To answer that, the story needs to be peeled layer by layer.
First, what pushed prices higher?
The near-term drivers are relatively easy to spot.
On the supply side, disruptions in major producing regions like Chile and Indonesia reduced output at a time when the market had little room for error. This came on top of a longer, deeper issue: declining ore grades and years of underinvestment in new copper mines.
In fact, UNCTAD estimates suggest that around 80 new copper mines will be needed by 2030 just to meet projected demand. That gap hasn’t been filled.
Trade dynamics added another push.
Concerns around potential US tariffs triggered stockpiling behaviour. Copper was pulled into US warehouses, tightening availability in other markets. This wasn’t driven by consumption surging overnight, but by buyers trying to insure themselves against policy risk.
Macro conditions helped too.
As expectations of US rate cuts in 2025 strengthened, real yields softened. Historically, that’s been a supportive backdrop for commodities, and copper benefited.
These factors explain the price action. But they don’t explain why copper demand keeps looking structurally tight even after accounting for all this.
For that, we need to look deeper.
What’s structurally changing?
The bigger shift is happening on the demand side.
Global refined copper demand (excluding scrap) reached nearly 27 million tonnes in 2024. By 2035, that number is expected to rise to 33 million tonnes, and by 2050, close to 37 million tonnes.
Electrification is the core driver here.
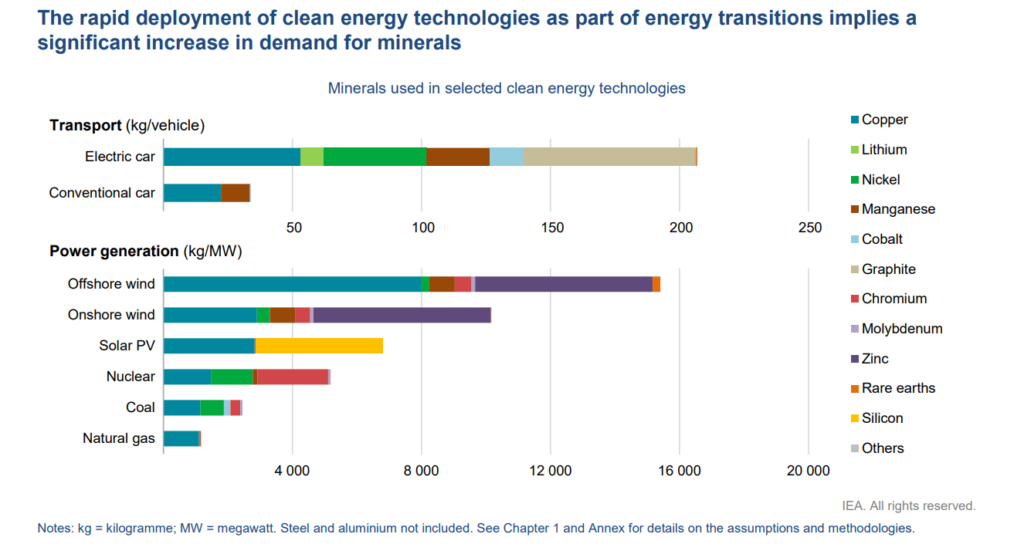
Electric vehicles, renewable energy, data centres, and power grids are all copper-intensive. Electricity network expansion alone is expected to more than double copper consumption, as grids are upgraded to handle decentralised power generation and rising loads.
In scenarios aligned with the Paris Agreement, clean energy technologies account for over 40% of total copper and rare earth elements demand over the next two decades.
But even this misses an important detail.
Because the real shift isn’t just how many EVs are sold.
It’s how those EVs are built.
Why motor technology suddenly matters?
Most EVs today use permanent magnet motors.
They’re efficient, compact, and widely proven.
But they rely heavily on rare earth elements.
And this is where geopolitics quietly enters the engineering conversation.
According to the Global Critical Minerals Outlook 2025, China is the leading refiner for 19 out of 20 critical strategic minerals, with an average market share of around 70%.
The concentration is even sharper in permanent magnets.
Two decades ago, China produced about 50% of the global production of sintered permanent magnets used in vehicles, wind turbines, industrial motors, data centres, and defence systems. Today, that share has climbed to 94%.
This level of dominance makes supply chains fragile.
For automakers, this is no longer a theoretical risk.
It’s a design constraint.
SRMs: An overlooked piece of the puzzle
As manufacturers look to reduce dependence on rare earths, Switched Reluctance Motors (SRMs) have moved from niche to strategic consideration.
SRMs don’t use permanent magnets.
Instead, they rely on copper windings to generate magnetic fields.
This doesn’t simplify materials.
It changes the mix.
More copper.
Less rare earths.
And when scaled, the impact adds up quickly.
Estimates suggest that copper demand from EV motors alone could rise 3.1× between 2023 and 2034. Not just because more EVs are sold, but because motor architecture is changing.
This is a second-order effect.
It doesn’t grab headlines.
But it steadily reshapes demand curves.
Why India sits at the centre of this shift?
India’s EV transition looks very different from that of developed markets.
Two- and three-wheelers dominate volumes.
Traffic conditions involve constant stop-start movement.
Vehicles operate in heat, humidity, and dusty environments.
These are exactly the conditions where SRMs perform well.
They are mechanically resilient, tolerate thermal stress better, and suit high-duty-cycle usage.
Several OEMs in India are planning to adopt rare-earth-free motor designs for two- and three-wheelers by FY27, not as an experiment, but as a scaled manufacturing choice.
This matters because India’s EV adoption is accelerating from a low base.
The share of electric vehicles in total passenger vehicle sales crossed ~5% in 2025, and the government has set a target of 30% EV penetration by 2030.
Motor decisions made today will shape copper demand for years.
Policy is reinforcing the direction
Policy alignment is subtle, but consistent.
Under FAME II, launched in 2019, over 1.5 million electric two-wheelers have been supported. While the scheme doesn’t mandate motor technology, its focus on localisation indirectly favours designs that reduce dependence on imported magnets.
The PLI scheme for automobiles and components goes further. It incentivises domestic manufacturing across EVs, powertrains, motors, and electronics, all copper-intensive areas.
As of 2025, approved investments under the scheme stand at around USD 9 billion, with beneficiaries ranging from legacy OEMs to newer EV players.
The message is clear, even if it’s not loud:
Build locally.
Reduce strategic dependencies.
Strengthen supply chains.
The copper constraint India cannot ignore
There’s a tension beneath all this.
Copper is one of the 30 critical minerals identified by the Government of India for its economic importance and supply-chain risk. Yet India remains heavily import-dependent.
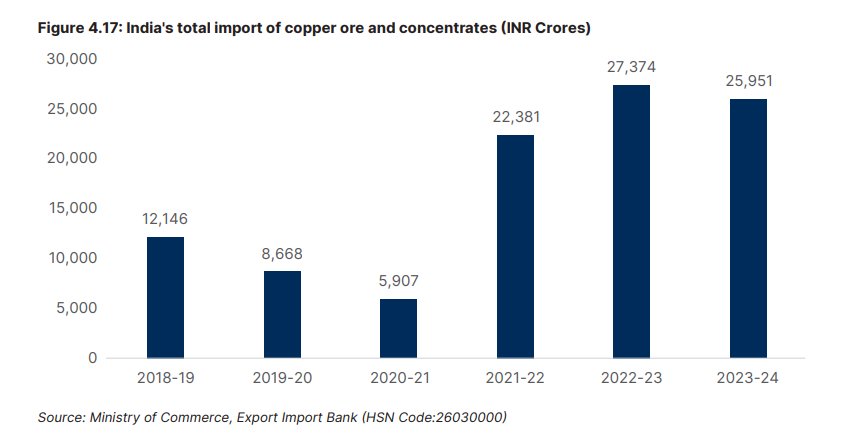
Copper imports rose to ₹26,000 crore in FY24, growing at a 21% CAGR since FY19.
The automotive sector already consumes about 10% of India’s copper demand, roughly 1.5 million tonnes in FY23, projected to rise to 1.7 million tonnes by FY27, with EV penetration as a key driver.
Globally, as primary output struggles to keep pace, copper scrap is increasingly viewed as a strategic asset, not just a recycling input.
Copper, in simple terms, is becoming harder to replace and harder to source.
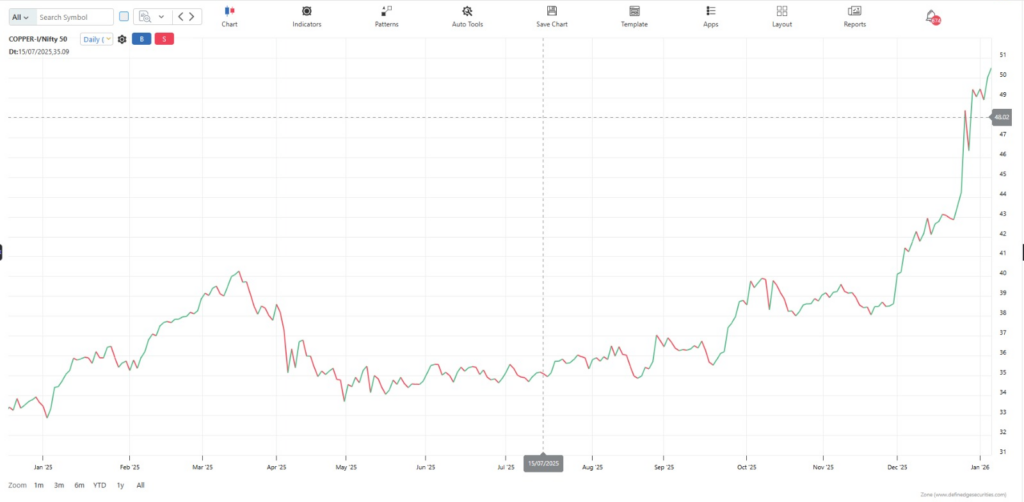
Outperformance of Copper vs Nifty 50
The comparison between the Nifty 50 and copper prices reinforces what the broader data is suggesting:
- In 2025, the Nifty 50 delivered returns of 10.51%, while copper prices rose by over 40%.
- Copper reflects industrial demand and real economic activity, not sentiment alone. The Nifty responds to expectations, earnings, liquidity, and policy. However, copper responds to activity. It rises when factories run, grids expand, vehicles get built, and projects move from plans to execution.
- While equities moved up earlier, copper accelerated later in the cycle, pointing to a late-stage pickup in industrial activity which is the phase where capex, electrification, and infrastructure spending begin to show up in actual material demand and consumption.
- At the same time, the copper breakout is a bullish confirmation, not a speculative spike. It indicates real demand strength and supports continued leadership in sectors most directly linked to copper consumption.
- In this phase, the signal from copper tends to favour sectors closest to physical demand such as metals, infrastructure, capital goods, and power and construction.
How this showed up in Momentify portfolios?
Market changes don’t announce themselves all at once.
They tend to appear first as relative strength and only later as a widely accepted story.
That pattern showed up in momentum portfolio signals.
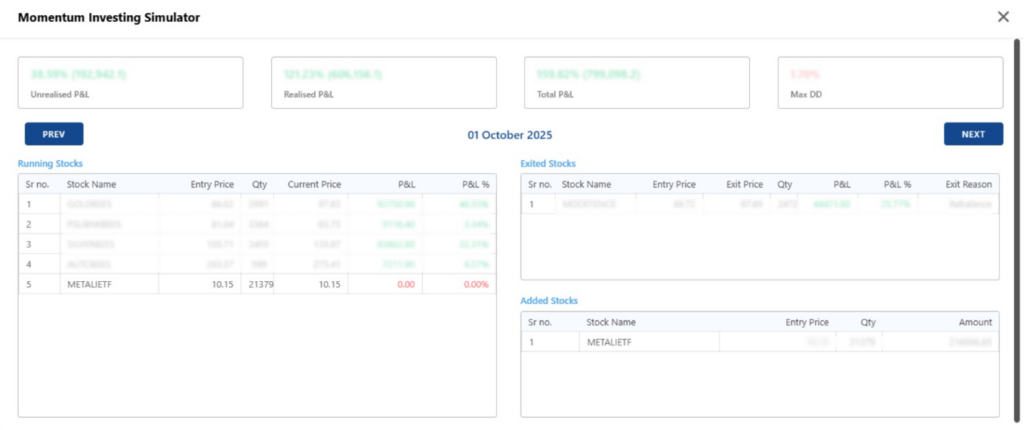
In October 2025, Momentify’s momentum framework added exposure to the metals space through a metal ETF, reflecting persistent relative strength and improving trend behaviour within the broader metals complex.
By early January 2026, that same metal ETF was up 11.43%.
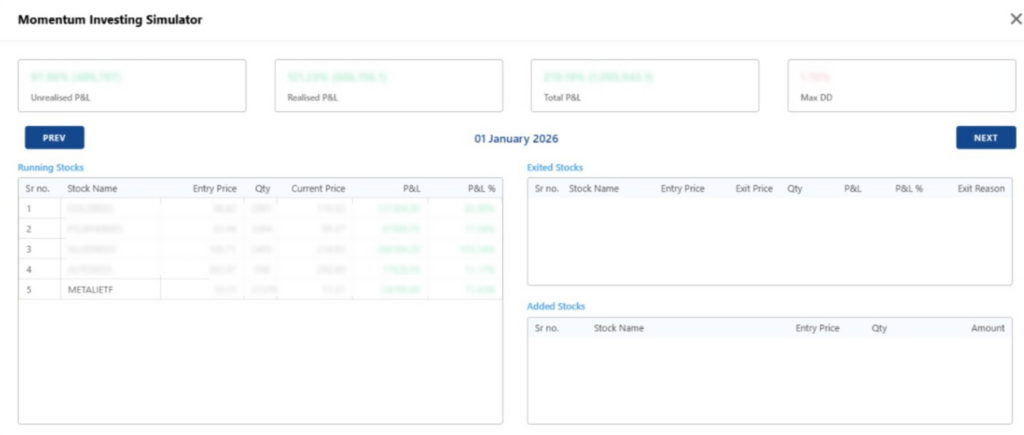
What matters here isn’t the return in isolation, but the sequence. The allocation preceded the wider discussion around copper’s outperformance versus equities, reinforcing a familiar pattern that structural demand often shows up in price behaviour before it becomes part of the prevailing narrative.
What’s worth watching from here?
So where does that leave copper?
Probably not at a dramatic turning point. And that’s the point. What matters now won’t show up in daily price moves.
It will show up in such decisions that feel small in isolation:
- An EV maker choosing a motor design that avoids rare earths.
- A utility committing to grid upgrades that stretch over a decade.
- A mining project approved today that won’t produce metal until the 2030s.
None of these change prices overnight. But together, they change what the market assumes about future supply and demand.
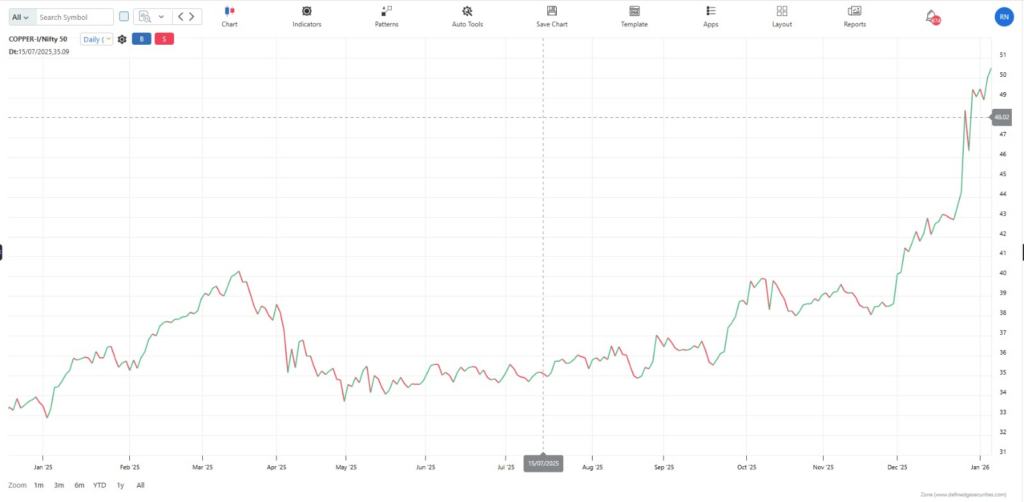
Copper outperforms not because of a single trigger, but because the cumulative effect of design, policy, and supply-chain decisions is being reflected in the copper-to-equity ratio.