Published on: September 11, 2025

In trading, one of the most common challenges is identifying the right stocks at the right time. Many traders focus on short-term charts, chasing price movements without considering the bigger picture. This often leads to false signals, missed trends, and unnecessary losses. This is where Multi-Time Frame Analysis (MTFA) comes in – a powerful methodology that allows traders to evaluate a stock’s trend across different time horizons, ensuring better decision-making and higher probability trades.
In this blog, we will explore the theory of Multi-Time Frame Analysis, the Top-Down Approach, the role of Bullish Heikin Ashi, and how to use Definedge RZone to scan and filter the best trading opportunities.
Understanding Multi-Time Frame Analysis
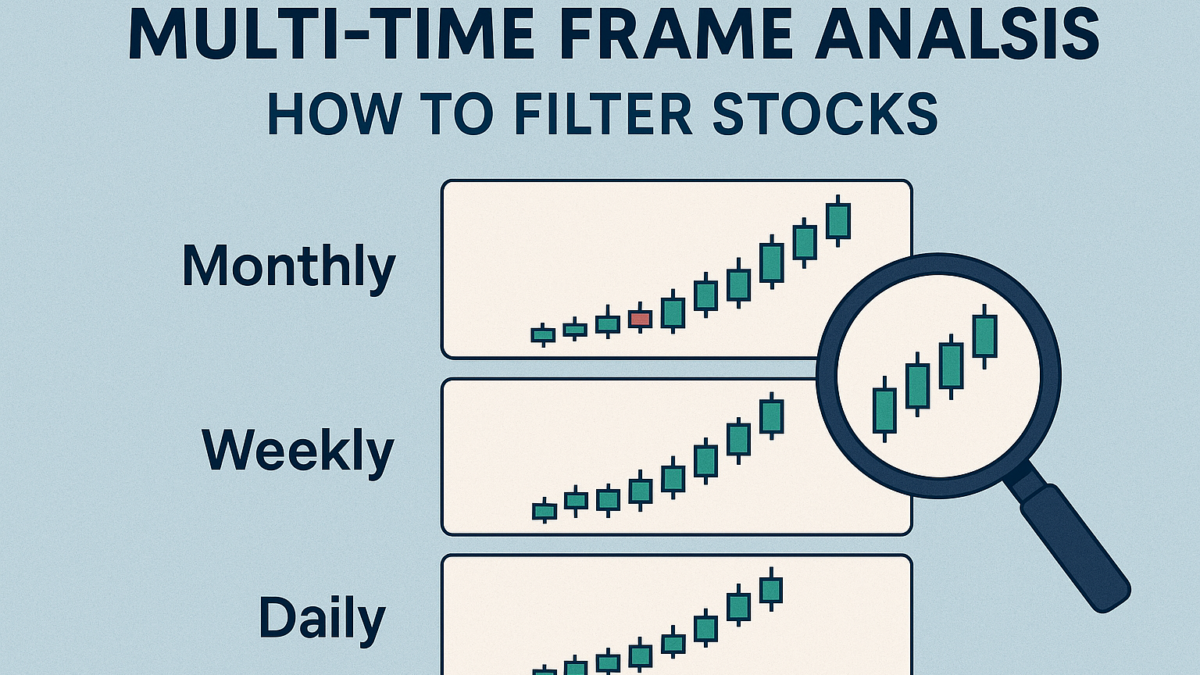
Multi-Time Frame Analysis (MTFA) is the practice of studying the same stock or asset across multiple chart time frames – typically Monthly, Weekly, and Daily – to identify the trend and optimal entry points. The core idea is simple: aligning trades with the bigger trend increases success rates.
- Monthly Charts: Show the long-term trend of the stock. A clear uptrend on the Monthly chart signals that the stock has strong momentum and is likely to continue moving higher over months or years.
- Weekly Charts: Offer an intermediate perspective, helping traders identify trend strength, consolidation zones, and key support and resistance levels.
- Daily Charts: Highlight short-term price movements and are used to time precise entries and exits.
By observing multiple time frames, traders can filter out noise, avoid trading against the trend, and identify trades with a higher probability of success.
The Top-Down Approach
A widely recommended strategy in MTFA is the Top-Down Approach, where analysis starts from the largest time frame and moves downward:
- Monthly Chart: Begin with the Monthly chart to identify the primary trend. Look for consistent bullish or bearish candles, long-term support/resistance levels, and trend strength. This step ensures that your trades align with the market’s primary direction.
- Weekly Chart: Once the long-term trend is identified, move to the Weekly chart. Confirm that the intermediate trend supports the long-term direction. This chart helps spot consolidation zones, breakouts, and patterns that provide additional confirmation for trade setups.
- Daily Chart: Finally, drill down to the Daily chart for timing your trades. Look for entry signals, stop-loss levels, and short-term trend patterns. When the Daily trend aligns with both Weekly and Monthly charts, it signals a high-probability trade.
This top-down method is especially effective because it ensures that short-term trades do not contradict the market’s dominant trend, improving trade quality and reducing the risk of false breakouts.
Why Bullish Heikin Ashi Works Across Multiple Time Frames
Heikin Ashi is a modified candlestick technique designed to smooth price action and highlight trends. Unlike regular candlesticks, Heikin Ashi reduces market noise, making trends easier to identify.
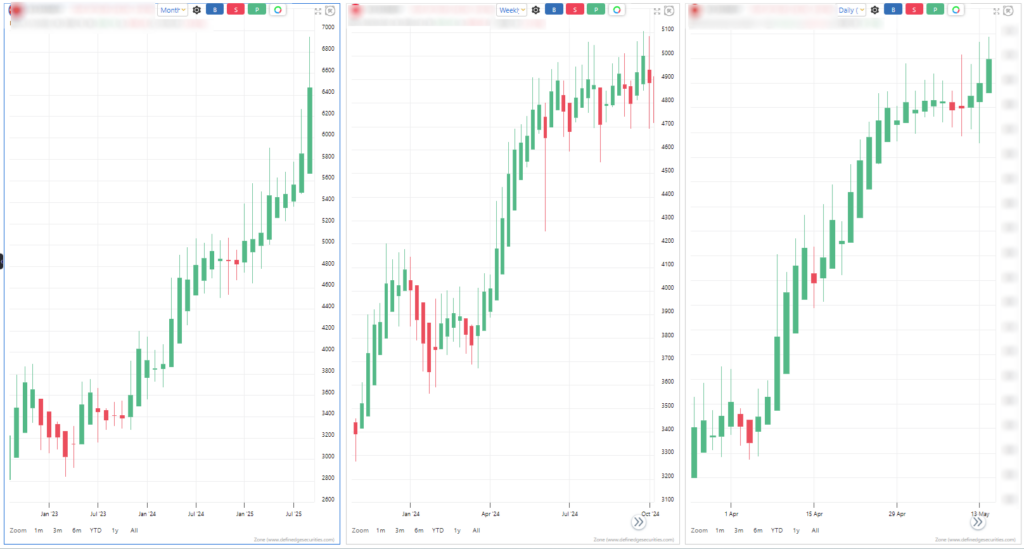
Using Bullish Heikin Ashi candles on Monthly, Weekly, and Daily charts offers several advantages:
- Monthly Bullish Heikin Ashi: Confirms a strong long-term uptrend. When a stock displays bullish Heikin Ashi candles on the Monthly chart, it indicates sustained upward momentum. Traders can avoid short-term trades that go against this primary trend.
- Weekly Bullish Heikin Ashi: Provides confirmation of the trend at an intermediate level. It helps identify whether short-term corrections or pullbacks are part of a healthy trend or signal a potential reversal.
- Daily Bullish Heikin Ashi: Offers precise entry points within the broader trend. Daily bullish candles allow traders to enter trades with confidence, knowing that they align with both intermediate and long-term trends.
By combining these three layers, traders filter for high-probability trades where short-term price action aligns with the bigger trend, reducing risks and increasing success rates.
Filtering Stocks Using Multi-Time Frame Analysis
To make MTFA actionable, traders need a systematic process to filter stocks. Here’s a step-by-step framework:
- Identify Long-Term Leaders: Begin with Monthly charts and list stocks with strong bullish Heikin Ashi candles, rising trendlines, or breakouts from long-term resistance.
- Confirm Intermediate Strength: Move to Weekly charts to validate the trend. Stocks showing bullish Heikin Ashi candles and increasing volume indicate stable momentum.
- Check Daily Charts for Timing: Finally, drill down to Daily charts for precise entries. Look for pullbacks to support, breakouts from consolidation, or reversal patterns that align with the Monthly and Weekly trends.
- Volume Confirmation: Always confirm trends with volume. Rising volume on bullish candles suggests strong participation and validates the trend.
- Stop-Loss Placement: Use the Daily chart to place stop-loss levels logically below recent support zones, aligning risk management with trend direction.
Using the Multi-Time Frame Feature in RZone
Definedge RZone makes MTFA simple and actionable with its Multi-Time Frame feature. Traders can scan and filter stocks across Monthly, Weekly, and Daily charts simultaneously. Here’s how:

- Step 1: Select Time Frames: Choose Monthly, Weekly, and Daily charts for analysis.
- Step 2: Scan Stocks: Filter stocks showing bullish Heikin Ashi candles across all selected time frames.
- Step 3: Plan Entries: Use the Daily chart in RZone to time entries and exits, ensuring alignment with Weekly and Monthly trends.
- Step 4: Execute with Confidence: By filtering stocks this way, traders focus only on those that meet multi-time frame trend criteria, reducing false signals and increasing the likelihood of success.
The RZone Multi-Time Frame feature saves traders hours of manual chart analysis and ensures that trade decisions are data-driven and trend-aligned.
Key Takeaways
- MTFA provides clarity: Aligning trades with Monthly, Weekly, and Daily trends improves probability.
- Top-Down Approach: Start with the big picture (Monthly), confirm with intermediate (Weekly), and fine-tune entries with short-term (Daily).
- Bullish Heikin Ashi: Smooths trends and highlights high-probability trades.
- RZone: Enables scanning and filtering stocks efficiently across multiple time frames.
By combining Multi-Time Frame Analysis, Bullish Heikin Ashi, and RZone scanning, traders can confidently identify high-probability trades, reduce market noise, and focus on stocks moving in the direction of the dominant trend.
Start implementing MTFA today and experience the clarity, precision, and confidence it brings to your trading journey.