Published on: December 25, 2025

Have you ever wondered how experienced traders ride the waves of Nifty, Gold, or Silver and seem to catch every big trend while others struggle in rough waters?
The powerful ADX indicator could be the answer, my trader friend!
What is the ADX?
The Average Directional Index (ADX) is more than just another technical indicator; it’s the compass that helps traders find their way through the rough waters of the Indian stock market. If you want to get ahead in trading Nifty stocks, Gold, Silver, or even stocks that aren’t as well known, learning about ADX can help.
The Past: From Wilder’s Desk to Dalal Street
Let’s go back to the late 1970s. One question that J. Welles Wilder Jr., a mechanical engineer who became a trader, couldn’t stop asking was, “How do I know if a trend is strong?”
He worked on it for months before making the ADX indicator, which is now a must-have on trading platforms. Smart traders from Wall Street to our own Dalal Street, now use ADX.
The Three Musketeers: Breaking Down the ADX
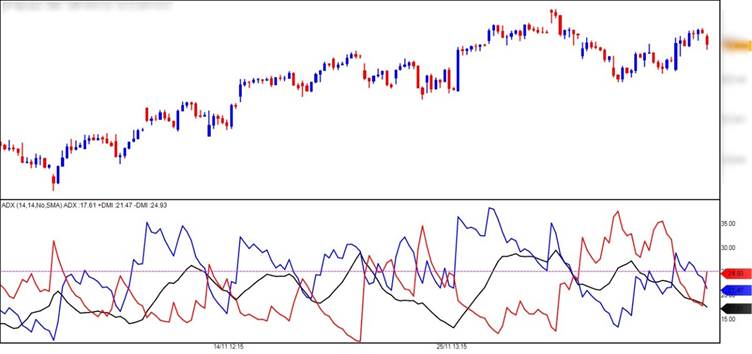
There are three lines in the ADX indicator, and each one has a different job:
- Line ADX (Black):
- Shows how strong the trend is, whether it is going up, down, or sideways.
- More than 25? A strong trend. Less than 20? The market is asleep.
- +DI – Plus Directional Indicator (Blue):
- Tells you how strong upward moves are.
- If +DI is higher than -DI, bulls are coming.
- -DI – Minus Directional Indicator (Red):
- Shows how strong downward moves are.
- Bears are in charge if -DI is higher than +DI.
Keep in mind that ADX only shows you how strong the trend is, not which way it is going.
Putting into practice: Being a Pro Trader
Let’s get down to business. How do you, a regular trader who wants to beat Nifty, Gold, or Silver, use the ADX in real life?
1. Finding the Power Moves: When ADX goes above 25, it’s time to pay attention. The trend (up or down) is getting serious!
If +DI is higher than -DI and ADX is going up, it’s time to ride the bullish wave.
Bears are having a party if -DI is above +DI and ADX is going up.
2. Avoiding false alarms: Is ADX less than 20? Don’t waste your time. The market is sleeping; you should look somewhere else.
3. Taking care of your trades: Use ADX to stay in trends longer. You should only leave when ADX starts to drop or goes back below 20.
Who Should Use ADX?
• Swing Traders: Do you love catching moves in Nifty or Gold that last for days? ADX is your best friend.
• Day traders: Do you want to stay away from markets that are going up and down? Before you pull the trigger, look for an ADX above 25.
• Traders who are in a position: If you want to ride the big waves in Silver or stocks that are going up, stay in as long as ADX says the trend is strong.
It’s easy to read and works with stocks, commodities, and indices, so both beginners and experienced traders can use it.
Scan ADX like a Pro
You might be thinking, “This sounds great, but do I really have to check every chart by hand?”
No way! RZONE’s ADX scanner is your quick way to look at the whole market in just a few minutes.
Go to Indicator Digger > ADX
What can you do with the ADX Scanner?
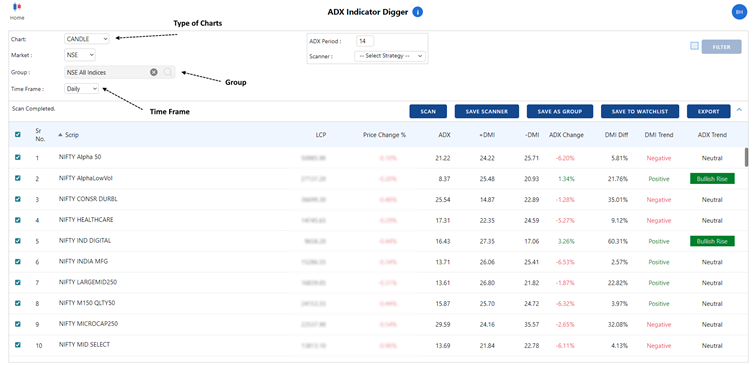
• Group Scan: Choose a group of stocks, like Nifty constituents, MCX for Gold, Silver, and Commodities or Sectors and Indices on BSE and NSE.
• Instant Insights: You can see the current ADX reading for each instrument in the group you chose.
• Volatility at a Glance: The ADX line’s percentage change shows you how volatile the market is. If it goes up, the trend is getting stronger and vice versa.
• Trend Strength: The distance between the +DI and -DI lines shows which side is winning, the bulls or the bears.
• Trend Analysis: The trend of DMIs (Directional Movement Indicators) and expert comments on the ADX trend help you quickly figure out what’s hot and what’s not.
• Personalised Settings: Change the ADX settings, like the period, to fit your own trading style or strategy.
• Data Export: You can export your scan results to a CSV file, which is great for sharing with your trading buddies or doing more in-depth analysis.
The Strength of ADX in Markets That Are Going Up
Let’s say that Nifty is getting a lot of attention because it’s hitting new highs. Is it real or just a trick? ADX will let you know if the trend is strong or weak. When international news shakes up Gold and Silver, ADX helps you ride the real moves and ignore the noise.
Useful Advice for Using ADX
- Don’t just use ADX on its own; for the best results, use it with price action, support/resistance, or charting patterns.
- Change for Volatility: If the market is very volatile, you might want to raise your ADX threshold from 25 to 30 to get stronger signals.
- Scan Often: Every morning, use RZONE’s ADX scanner to find new trends and stay away from markets that are dead.
- Backtest: Before you put all your money on the line, test your ADX strategy on Nifty, Gold, or Silver to make sure it works.
The ADX indicator is like a market X-ray machine. Knowing when the trend is strong can make a big difference if you trade Nifty, Gold, Silver, or any stock in India. You don’t have to be a chart ninja to find the hottest trends with useful tools like RZONE’s ADX scanner. So, the next time you hear traders talk about the “secret sauce” that makes their trades work, remember that they might just be talking about the ADX!